More and more today I’m seeing reports in the media about the housing market cooling down and sales slowing which, quite frankly, I have expected and keep watching for signs of it in the St Louis real estate market. However, in spite of a few blips on the radar, all the data I’m reviewing still shows pretty steady and consistent home sales in St Louis. Don’t get me wrong, I fully expect us to see a cooling of the St Louis market if for no other reason, winter will be here soon and then we’ll be headed toward year-end when the market always cools down. There are many factors that could come into play to further impact the market such as higher interest rates, a weaker economy as well as an influx of foreclosed homes hitting the market in the month ahead. For all of this, we will have to wait and see, but for now, things are pretty steady. Below are some charts and data that I feel support my thoughts on the market.
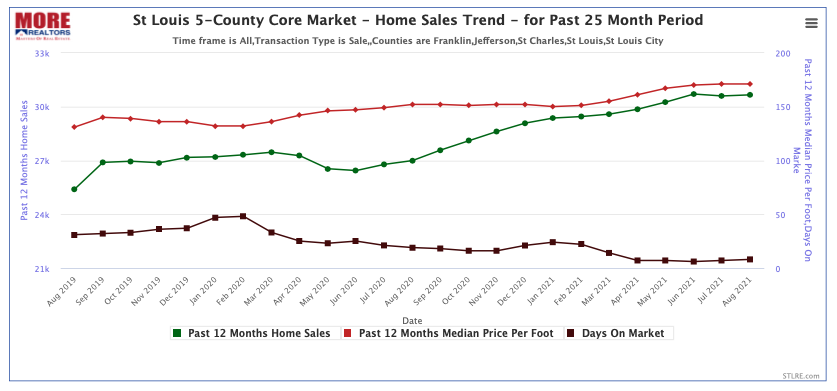
St Louis 5-County Core Market – Home Sales Trend
(click on chart for live, interactive chart)
As the chart above illustrates, the time it takes for a home to sell (days on market, represented by the brown line at the bottom) has been consistent the last four months, ranging from a low of 6 days to a high of 8 days. The green line shows the 12-month home sales trend and it has been fairly consistent the last 4 months as well, actually increasing in June, then dipping slightly in July only to rise again in August to nearly June’s level. Finally, the red line shows the median price per foot of the homes sold and that has also been consistent the last 4 months with a slight increase from $167/foot in May to $170 in June and then $171 in July and August.
St Louis Real Estate Trends Report
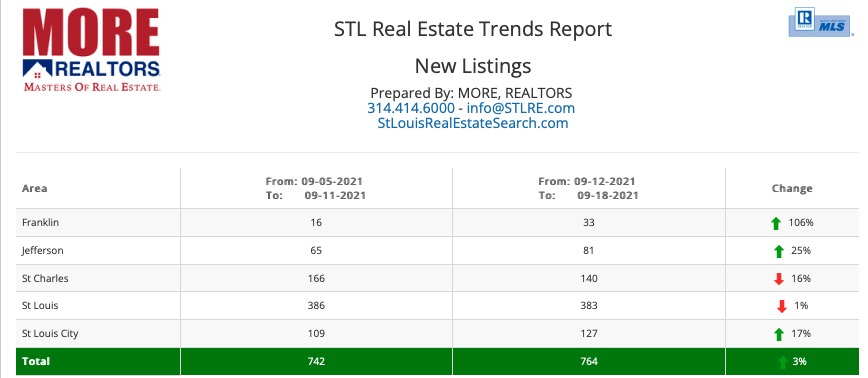
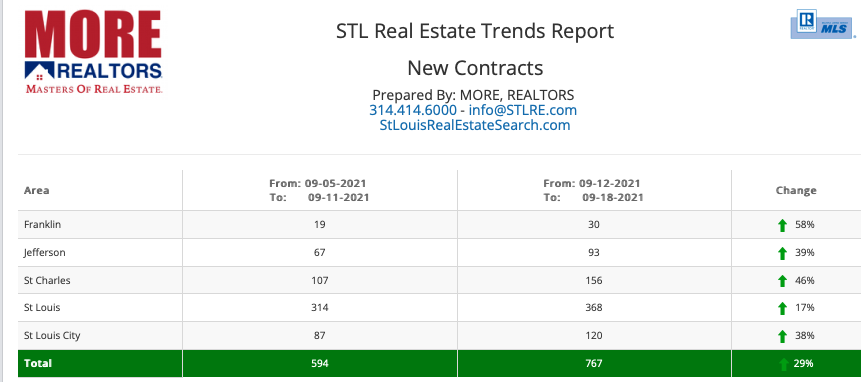
New Listings & New Sales (click on report for live report)
The above reports show that in the most recent week new contracts written for the sale of homes increased 29% from the week before and new listings increased 3% from the week before. During the week there were just about the same number of new listings as new sales at 764 and 767 respectively.
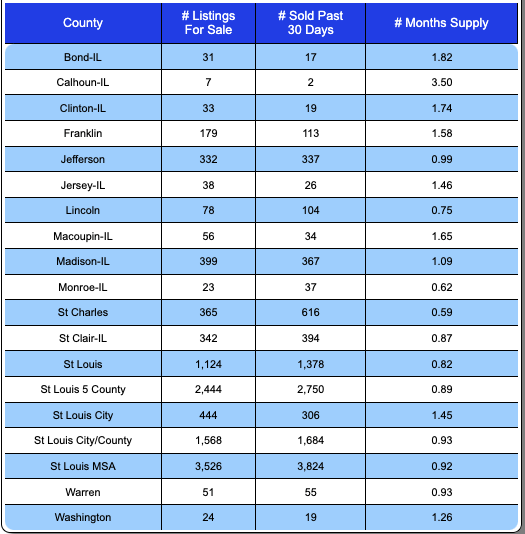
St Louis Area Supply of Listing Inventory
(click on report for live report)
The report above shows there is currently a 0.89 month supply of homes for sale in the St Louis 5-County market. This is only slightly higher than it has been in past months. Of the 5-counties in the core market, St Charles County has the lowest inventory of homes for sale with an inventory of just over half a month.


