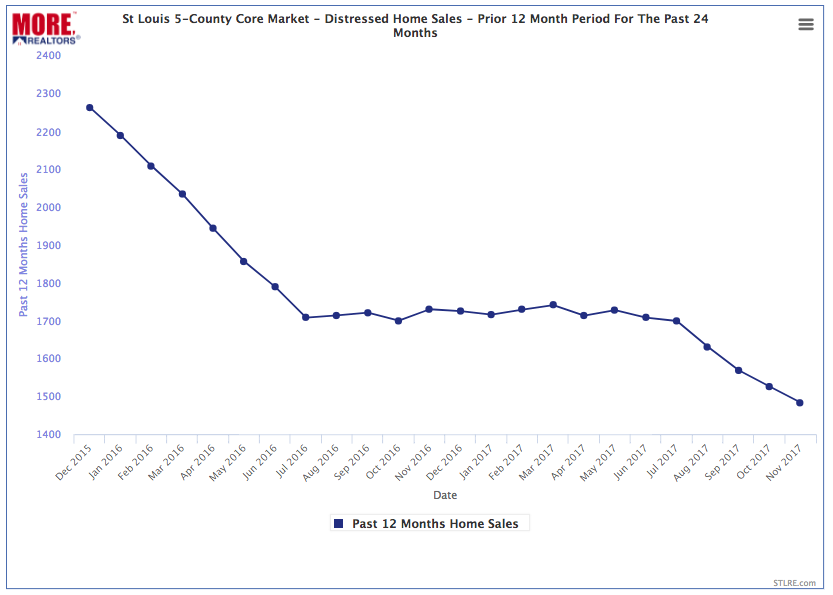
Distressed home sales, foreclosures, bank and government-owned homes and short sales, continue to decline in St Louis as the economy and housing market continue to improve. The chart below illustrates this downward trend as, for each monthly data point, it shows the total number of distressed home sales in the 5-county core St Louis market for the prior 12-months. Plotting out the prior 12-month activity is a great way to spot trends and changes in the market. As the chart shows, for the 12-month period ending last month, November 2017, there were 1,484 distressed home sales, down over 34% from December 2015 when there were 2,263 distressed home sales during the prior 12 months.
St Louis 5-County Core Market – Distressed Home Sales- Prior 12-Month Period Monthly For Last 24 Months
(click on chart for live data)


