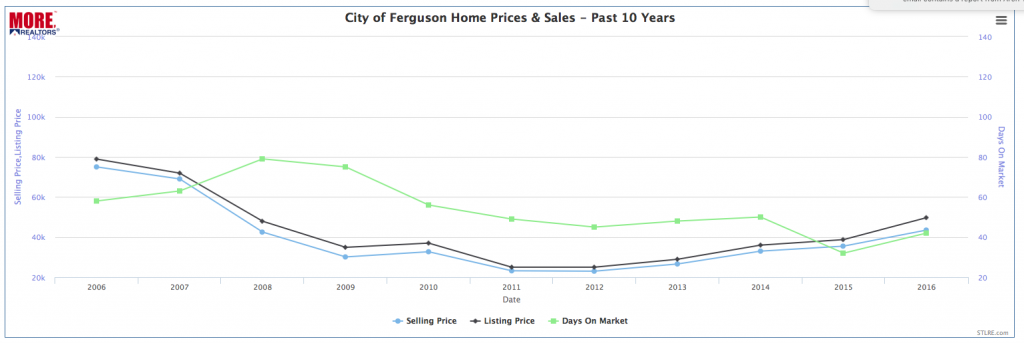
A lot has happened to affect the real estate market where I grew up in the little town of Ferguson in North County over the past decade. First, like the rest of the country, beginning around 2000, Ferguson saw home prices increase at rates outpacing inflation until finally peaking in 2006 which then led to the housing market bubble burst shortly thereafter. Home prices in Ferguson, and everywhere else, then declined over the next few years until hitting bottom around the end of 2011, or beginning of 2012.
Then, as pretty much most of the St Louis housing market was enjoying a slow and steady comeback in home prices and sales in 2014, came the shooting of Michael Brown by Ferguson police officer Darren Wilson which resulted in riots and violent protests that unfortunately made Ferguson a household name not only around St Louis but around the country and even beyond. Surprisingly, even though that put yet another damper on the real estate market in Ferguson, as the chart below shows, home prices continued the increase begun after hitting bottom in 2012 in spite of it.
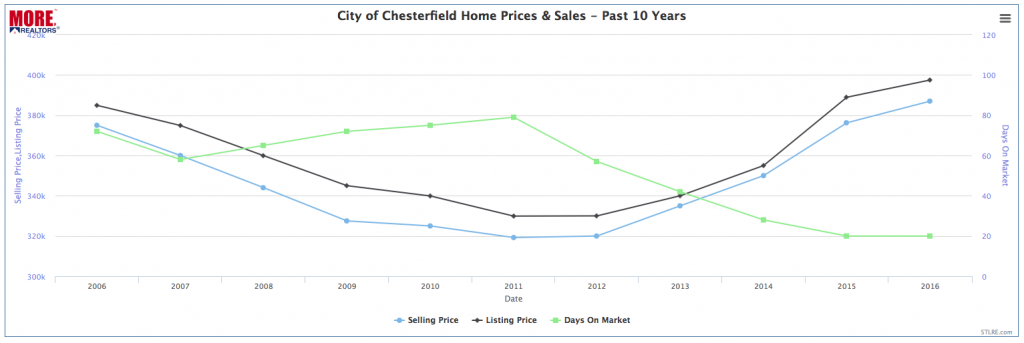
For comparison purposes, I decided to put a 10 year chart of home prices for Ferguson next to the same for the City of Chesterfield. Chesterfield is an affluent city in west St Louis County that has enjoyed a fairly robust housing market for a long time now and has not had anything to deal with like Ferguson did with the shooting. When you look at the two charts (which you can click on to see a live chart with actual prices shown as you move your mouse over data points) you will see there is quite a disparity between the two cities. For example, during 2016, the median sales price for a home in Chesterfield was $387,000, a 3.2 percent increase from 2006 when it was $375,000. For Ferguson, the median price of homes sold during 2016 was $43,509, a decline of nearly 42 percent from 2006 when the median home price in Ferguson was $75,000.
Search St Louis Homes For Sale HERE
See ALL Homes That Will Be Open In St Louis This Weekend
Coming Soon Listings – Be The First!
Ferguson Home Sales & Prices – 2006 -2016
Chesterfield Home Sales & Prices – 2006 -2016
A closer look:
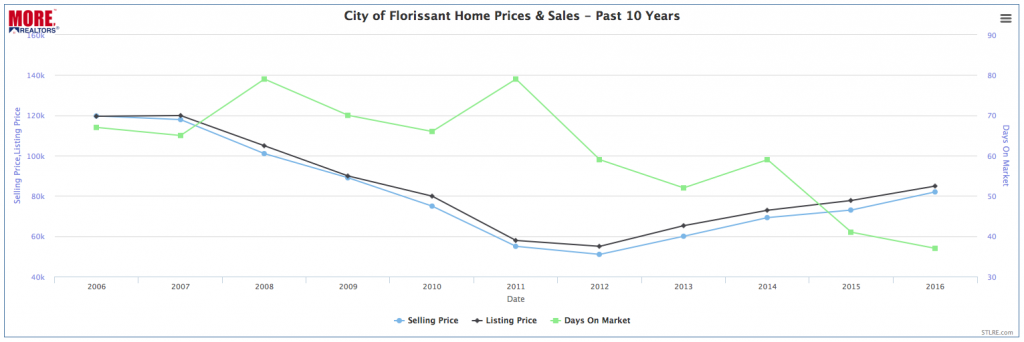
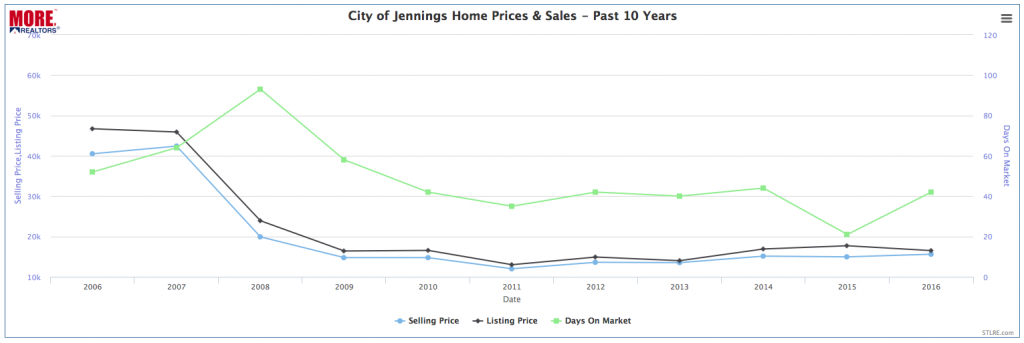
One caveat I should add, is part of what we are seeing in the data, I believe, is the result of overly inflated home prices in areas like Ferguson back during the housing boom as a result of sub-prime lending and other practices that artificially inflated home prices well in excess of where they should have been. In the case of Ferguson, and the difference in home prices over a 10 year period compared with Chesterfield, this could be more responsible for the difference than that shooting and riots in Ferguson. To take a closer look at this, I pulled 10 year charts for two neighbors of Ferguson, the city of Jennings and the city of Florissant, neither of which has had to deal with anything like Ferguson had to in 2014. As the charts below reveal, home prices in Jennings have fallen over 61 percent from a median price of $40,500 in 2006 to a median price of just $15,600 in 2016 and home prices in Florissant declined 31 percent from $119,700 in 2006 to $82,000 in 2016. When we look at these two neighboring cities for comparison (even with Florissant having a much higher overall median home price) we see that the decline in home prices in the City of Ferguson does not appear to be out of the normal range, nor have been affected that much by what many are referring to as “the Ferguson effect“.


