After the housing bubble burst in 2008, home prices finally hit bottom in the St Louis metro area, as they did in most areas of the U.S., during 2012. Since then, home prices in most areas have not only regained the post-bubble burst losses but have appreciated handsomely as well. For the St Louis MSA, the median price of homes sold has increased 34% from 2012 through today, an annual growth rate of 4.98%. The steady and fairly significant, increase in home prices in St Louis has caused some to ask if it is “too much, too fast?”. In other words, at this rate, are we headed toward another bubble?
I don’t see a bubble…
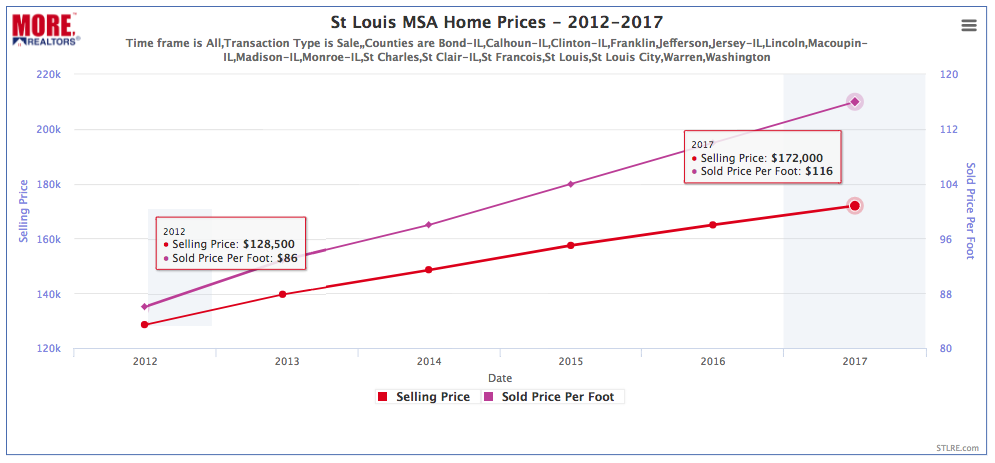
As the chart below shows, the median home price for the St Louis MSA in 2012 was $128,500 and for 2017 thus far it is $172,000, or 34% more. This works out to an annual growth rate of 4.98% which, historically speaking, is not out of line. In 1963, the median home price in the U.S. was $17,950 and today it is $315,200, which computes an annual growth rate of 5.35%. So, over the 55 year period I reviewed, the growth rate has exceeded the rate we have seen in St Louis since 2012 making the increase not out of the norm.
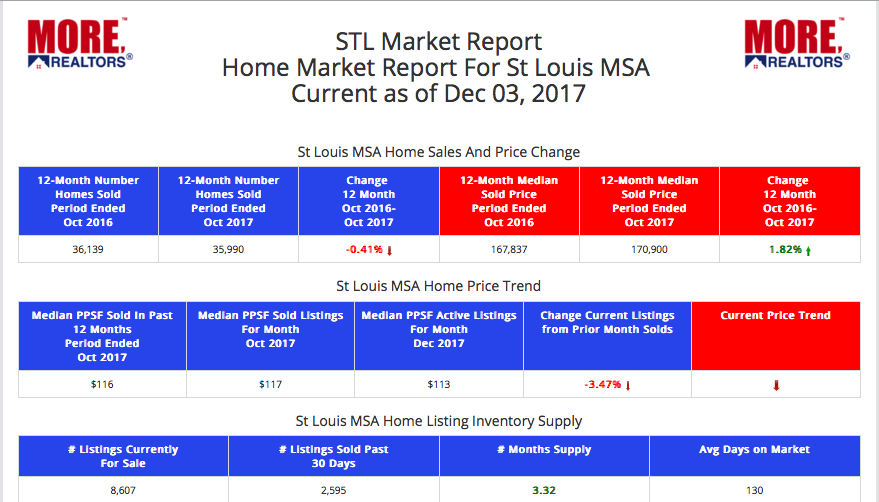
Additionally, as our STL Market Report for the St Louis MSA below the chart shows, we are in the slowest selling season of the year and the inventory of homes for sale is still low at about 3 1/3 months supply.
St Louis MSA Home Prices 2012 – 2017 (Chart)
St Louis MSA – STL Market Report – December 2017 (Table)


