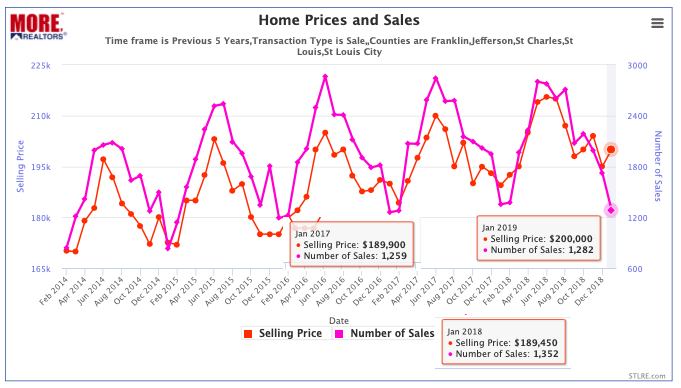
Many of the forecasts for home sales this year call for either a slight decline from last year or about the same as last year, in terms of home sales. I think the St Louis market will probably see about the same number of homes sold in 2019 as we did in 2018, it may just come with a little bit of a price adjustment. So, while I don’t like looking at home sales “year over year” for one month, I’m going to make the exception today and include that. As the first chart below shows, in January there were 1,282 homes sold in the St Louis 5-County core market (non-distressed home sales) which is down 5% from January 2018 when there were 1,352 homes sold but is up nearly 2% from January 2017 when there were 1,259 homes sold.
St Louis 5-County Core Market Home Sales and Prices (Non-Distressed) Past 5 Years
(Click on chart for a current chart with live data)

The Home Sales Trend In St Louis Remains Favorable
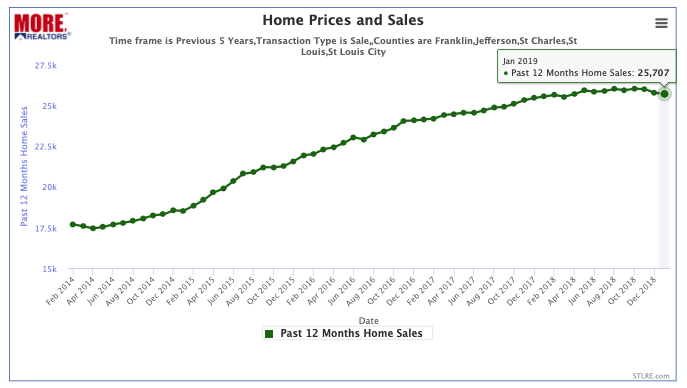
As our chart below illustrates, the home sales trend for the St Louis 5-County core market continues to look good. The chart plots the past 12 months home sales total for each month making it easy to spot trends and shifts in the market. There was steady growth in the home sales trend from 2014 through early 2018 then the trend leveled off and has remained around the same level since. For the 12 month period ended January 31, 2019, there were 25,707 homes sold which is just a little higher than the trend a year ago when there were 25,547 homes sold in the prior 12 month period. The trend line peaked in October 2018 with 26,027 homes sold in the prior 12 month period. So, at this point, we are just 1.2% off the peak.
St Louis 5-County Core Market Home Sales Trend – Past 5 Years
(Click on chart for a current chart with live data)


