In the last week, I’ve seen several reports indicating declining home sales on both a nationwide basis as well as for the St Louis market. The reports vary widely but one local report indicated single family home sales were down 6 percent from a year ago, which, of course, should cause some concern for both agents as well as consumers since a 6 percent decline is significant. However, this is why, for this very reason, MORE, REALTORS® developed their own proprietary software to analyze and report the market data (the same MLS data as the aforementioned report was based upon) and present it in a manner that more accurately depicts the market conditions and is more applicable than many of the other reports out there.
Before I go further, I’m not picking on anyone reporting market information, as most are simply reporting the data that is available to them and doing so in a common manner which is to look at data for one specific month (in this case November) and compare it to the same month a year ago. I’m just suggesting that due to fluctuations that can be caused by, for example, weather during the month, the number of Friday’s during the month (a popular day for closings), etc. looking at a single month doesn’t paint a true picture of the market. It also matters what area the data is for, is it the St Louis MSA (which includes 8 counties in Illninois) or the city of St Louis, or some other combination?
As you will see from our STL Market Report™ tables I’ve prepared below, the St Louis real estate market is actually holding fairly steady in terms of sales when we look at the past 12-month period and compare it with the prior 12-month period. In terms of home prices, St Louis home prices have increased about 4% – 5% in the St Louis area, depending on how we look at the area.
St Louis MSA-
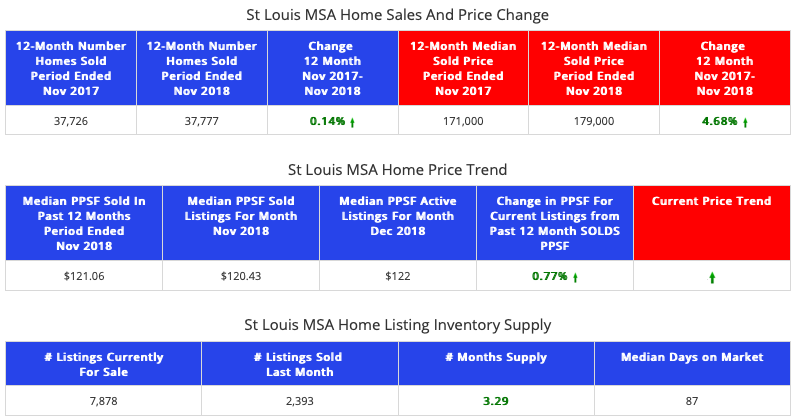
For the St Louis metro area as a whole, home sales for the past 12 months in the St Louis metro area were just about the same as the prior 12-months and home prices increased in the St Louis metro area a little over 4.5% during the period.
St Louis MSA – Home Sales and Prices – Past 12 Months vs Prior 12 Months
St Louis 5-County CORE Market-
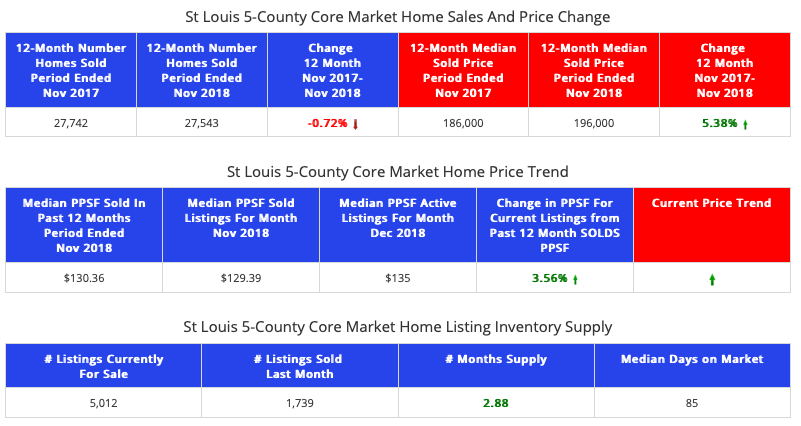
For the St Louis 5-County core market (the city of St Louis and counties of St Louis, St Charles, Jefferson and Franklin), home sales for the past 12 months were down slightly from the prior 12-months and home prices increased in the St Louis 5-County core market nearly 5.5% during the period.
St Louis 5-County CORE Market – Home Sales and Prices – Past 12 Months vs Prior 12 Months
St Louis City/County-
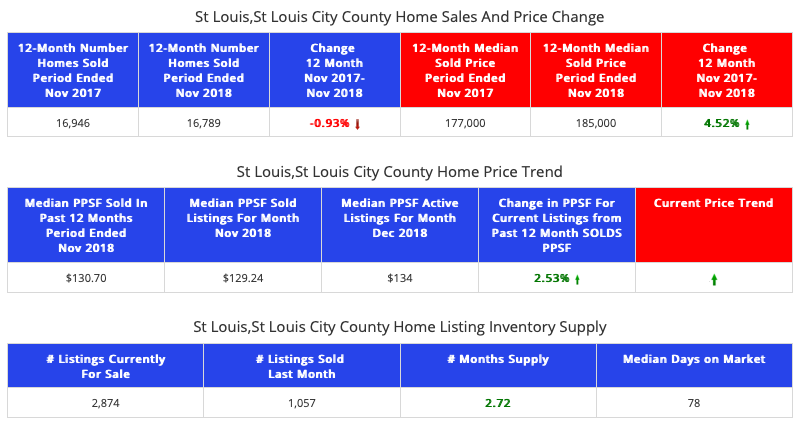
For the St Louis city and county combined, home sales for the past 12 months were down nearly 1% from the prior 12-months and home prices increased in the St Louis City/County combined market about 4.5% during the period.
St Louis City/County – Home Sales and Prices – Past 12 Months vs Prior 12 Months

St Louis Home Sales Trend
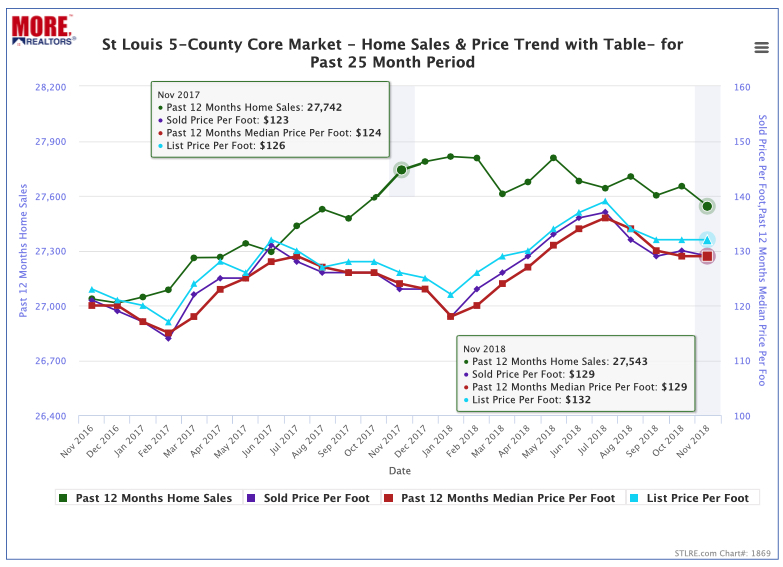
We also produce STL Market Charts™ which are very useful in illustrating housing market conditions and to make it easier to spot trends. The chart below, for the St Louis 5-County Core market described above, charts on a monthly basis, the prior 12-month home sales which shows how St Louis home sales are trending. As the green line on the chart depicts, the trend in home sales is moving downward a little and if you look at last year at this time the sales trend was still upward. Last year the downward sales trend didn’t start moving downward until February so we got there a little quicker this year. If this trend continues then it is likely we will see fewer home sales in the coming 12 months than the last 12, however, nothing makes me believe at this point that the difference will be significant.
St Louis 5-County Core Market – Home Sales and Price Trend
(click on chart for live, interactive chart)


