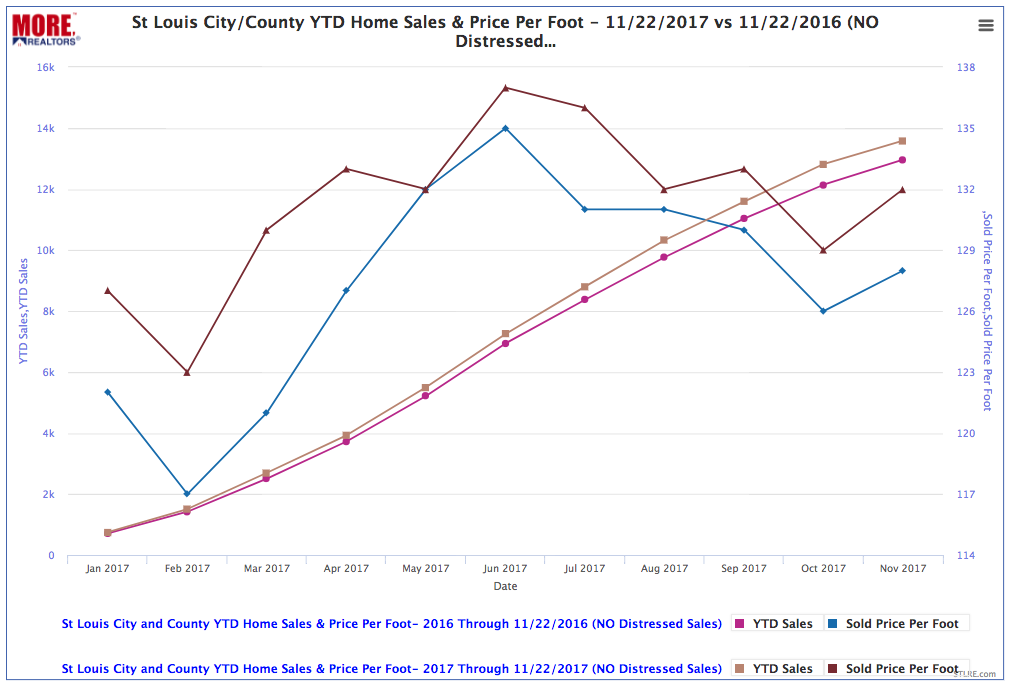
Home sales in the city and county of St Louis this year have pretty consistently, from month to month, been at a pace roughly 5 percent higher than at the same time last year. As our chart below illustrates, we began this year with 747 homes sold (not including distressed sales) in St Louis city and county, an increase of 5.2% from January 2016 when there were 710 homes sold. As of the end of October, there were 12,824 homes sold this year, an increase of 5.6% from the same time last year when there were 12,145 in the city and county of St Louis.
Home Prices Rise Modestly In St Louis City & County…
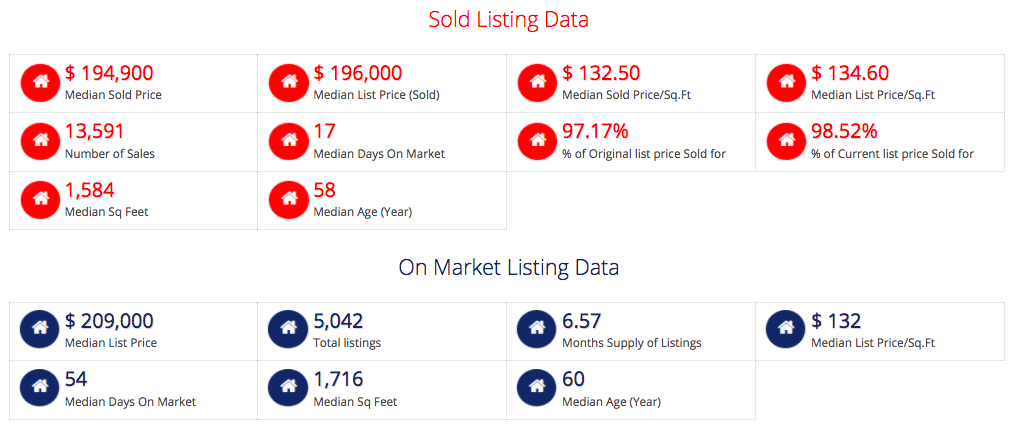
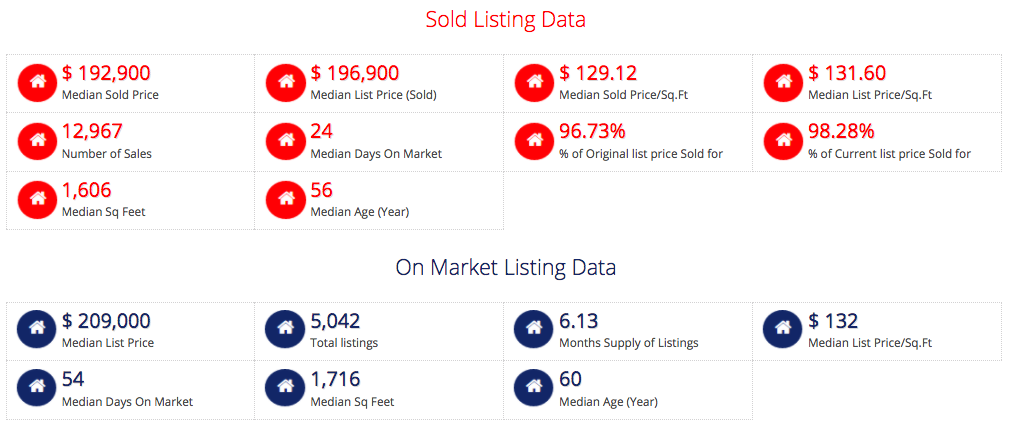
As the chart and tables, below show, the price per foot that homes sold for (the most accurate way to compare prices) this year has with the exception of May, been higher than for the same period last year. For the past couple of months, the price per foot has been either side of 3% higher than the corresponding period last year. As the YTD table for 2017 shows, the actual median price of homes sold this year, in the city and county of St Louis, has been $194,900, an increase of about 1% from last year’s median price of $192,900 for the same period.
Plenty of Homes For Sale in St Louis City and County…
Referring to the tables below again, you can see that, as of today, there is a 6.57 month supply of homes for sale (non-distressed) in St Louis city and county, putting the market into buyers market territory somewhat, and an increase of a little over 7 percent from the same time last year when there was a 6.13 month supply of homes for sale.
Why You SHOULD Be A Data Nerd, or at least, Pick One For An Agent!
Ok, I’ll admit it…I’m a data nerd! I love analyzing the real estate market and trends. I could sit for hours studying the market, computing prices, and spotting trends. I also love teaching our agents to do the same as well as sharing the results I glean from the data with our agents, to help them stay informed, on top of the market and able to better serve their clients. I also love educating consumers about the real estate market to equip them to make smart decisions when buying or selling real estate, or when choosing an agent.
Why is this so important? GIGO! That’s why!
What in the world is GIGO? A computer science term which means, to quote Wikipedia: “(GIGO) is where flawed, or nonsense input data produces nonsense output or “garbage…..The principle also applies more generally to all analysis and logic, in that arguments are unsound if their premises are flawed.”
So, in a nutshell, if you, or your real estate agent is getting “flawed” or “nonsense” data, then the output, or result, will be “garbage”. Considering that, for most normal folks, buying or selling a home is often the largest transaction they make, it’s worth avoiding making decisions about that transaction based on bad info.
This is why we work so hard at delivering the best St Louis area home sales, and prices data. I’ll now give you a couple of quick examples of how abundant bad data is out there and how it may differ from what I have here.
- From a very popular national real estate search site: “The median home value in Saint Louis is $131,300. Saint Louis home values have gone up 18.3% over the past year“
- From a website that gives “neighborhood information”, the median home price in St Louis is currently $136,192.
- From a trade association in the real estate industry…”While the median sales price (in the city and county of St Louis) increased 7 percent from $160,000 in October 2016 to $171,000 this year”
Get the idea? Even what appears to be, or may, in fact, be, very credible sources of home price and market data for St Louis, can be very wrong. None of this is intentional, but, instead, a result of there being “too much” information available today and, without going through some effort to sort through it, it can easily be GIGO data.
How does the GIGO data happen?
- Much of the home price data you see quotee for St Louis is for the St Louis MSA, which includes 17 counties, 9 in Missouri and 8 in Illinois.
- We clearly identify what data we are reporting, such as, in this article, data for the City and County of St Louis.
- Most of the data sources are probably reporting data which includes distressed home sales (foreclosures, short sales, etc) which can, in some areas where there are a lot of them, such as the city of St Louis, dramatically affect home prices.
- We often filter out distressed sales, particularly when reporting data for an area where they can impact the data significantly (like in the city and county of St Louis) and then clearly identify what the data represents..
- “Home prices” is generally the term used, but often times, the data reported actually combines condo prices with home prices. Condo’s sell for different prices, and appreciate and different rates, than homes, so this can skew the data as well. If we report “home prices” we have filtered out condo sales.
In addition to all of the above, there are many other reasons why it is hard to find accurate and timely home price and sales information for the St Louis area. The large number of municipalities St Louis county is chopped up into is part of it, as is the fact that the city of St Louis is not within St Louis County and that the REALTOR MLS here requires subdivision names to be entered manually, giving rise to errors and difficulty in getting good subdivision level home price and sales data.
This is why at our firm, MORE, REALTORS, we have worked so hard and spent so much time and money developing our own proprietary software to assure our agents, and their clients, have access to, the most accurate and timely, St Louis area home price and sales data possible.


