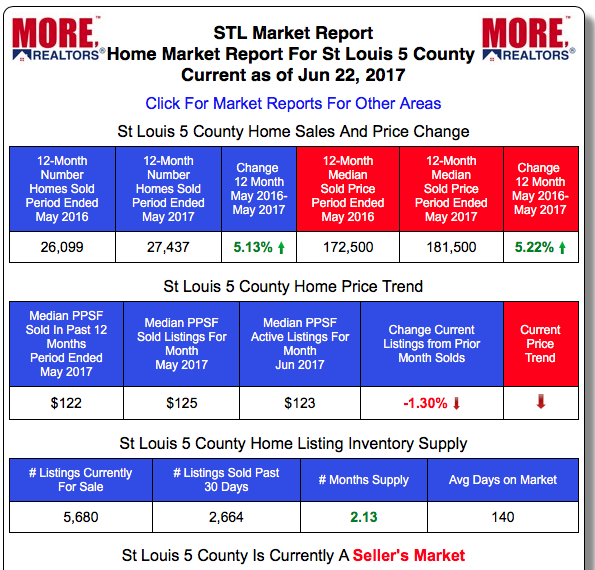
St Louis continues to enjoy a pretty robust real estate market, albeit it a challenging one for buyers due to the low inventory of homes for sale in most areas, with St Louis home sales, during the past 12 months, up over 5 percent from the prior 12-month period and St Louis home prices up over 5 percent for the same period as well. As the table below shows, in the 5-county core St Louis market, there were 27,437 homes sold in the 12-month period ending May 31, 2017, an increase of 5.13% from the prior 12-month period when there were 26,099 homes sold.
Year-over-year for the month of May looks good as well…
As I frequently comment, looking at home prices and sales activity for a 12-month period is the best way to get a realistic view of the market, less affected by timing of sales due to weather, day of the week the last day of the month falls on etc, it’s still worth looking at the most recent month and comparing it to the prior month, as well as prior year, to help spot trends or changes in the trend. With this in mind, as the chart below shows, for the St Louis core market there were 3,070 homes sold in May, 2017, an increase of 21.2% from the month before when there were 2,533 homes sold, and an increase of just under 1% from May 2016 when there were 3,042 homes sold. As the chart also reveals, homes sold in St Louis during May, 2017 were sold for a median price of $185,000, an increase of 2.8% from the month before when the median sales price was $180,000 and a slight increase of just one-half of one-percent from May 2016 when the median price St Louis homes sold for was $184,000.
Franklin County has the largest increases in home prices and sales during past 12 months…
Search St Louis Homes For Sale HERE
See ALL Homes That Will Be Open In St Louis This Weekend
Get Home Prices and Sale Charts For ANY Area- STLMarketCharts.com
Get Home Prices and Sale Tables and Data For ANY Area- STLMarketReports.com
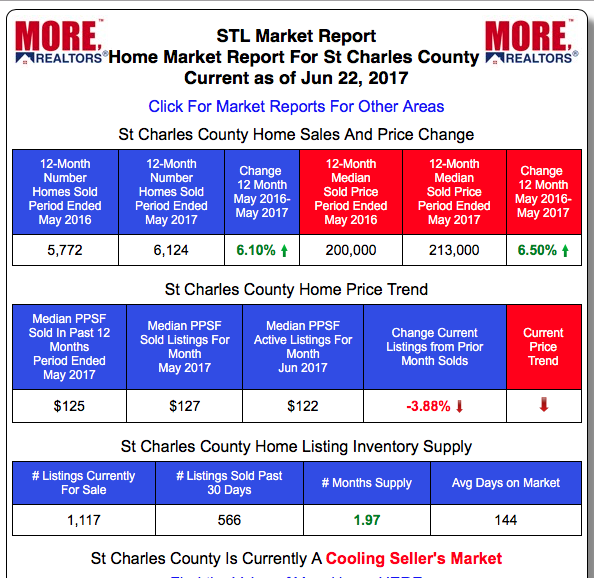
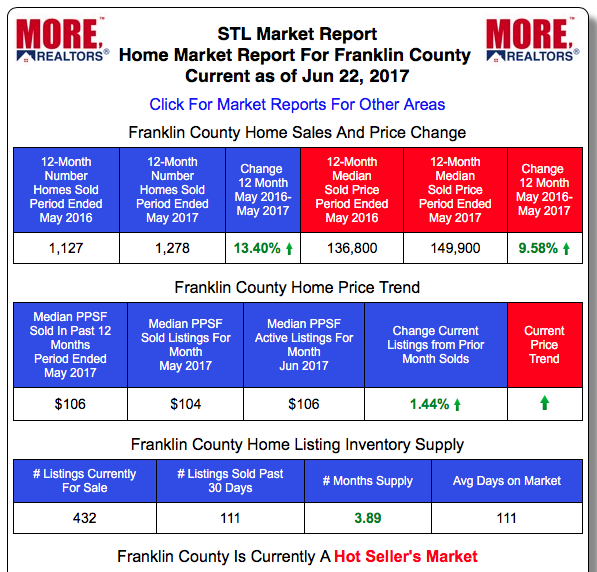
Below, I have include our STL Market Reports for the counties included in the 5-county core market and they revealed that Franklin County has seen the largest increase in home sales and home prices during the most recent 12-month period from the prior year. Franklin County saw home sales increase 13.4% and Franklin County home prices increased 9.58%.
St Louis City/County has the lowest supply of homes for sale….
As the tables below reveal, all of the counties in our 5-county core St Louis market are showing good home sales, home prices and all are favoring sellers, however St Louis City/County has the lowest supply of homes for sale with less than a 2-month supply (1.94 months) based upon the current rate of sales.
The data behind the story above.
All of the tables and charts shown below are created using proprietary software developed by MORE, REALTORS and is based upon home sales data obtained from Mid-America Regional Information Systems (MARIS), the REALTOR MLS. These products were developed to assure that the most accurate St Louis home price and sales data could be presented in a format that would be useful and beneficial for home buyers, sellers, investors as well as real estate agents and brokers. You can click on any of the tables or charts to go to the “live” version with complete data. You can also request charts or tables for any county, city, zip, school district, neighborhood, etc in the area by clicking on the button on the charts or reports pages.
St Louis Real Estate Market Home Prices and Home Sales – Past 12-Months vs Prior 12-month period
(5-county core market consisting of St Louis City and the Counties of St Louis, St Charles, Jefferson and Franklin)
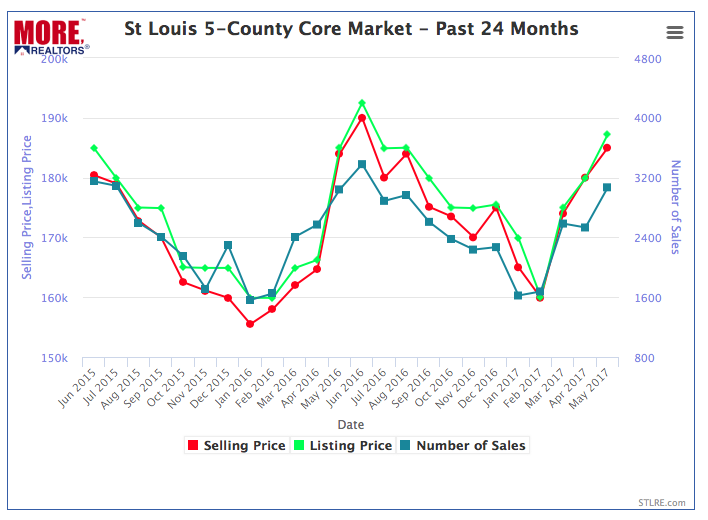
St Louis Real Estate Market Home Prices and Home Sales – Past 24-Months (Chart)
(5-county core market consisting of St Louis City and the Counties of St Louis, St Charles, Jefferson and Franklin)
St Louis City/County Real Estate Market Home Prices and Home Sales – Past 12-Months vs Prior 12-month period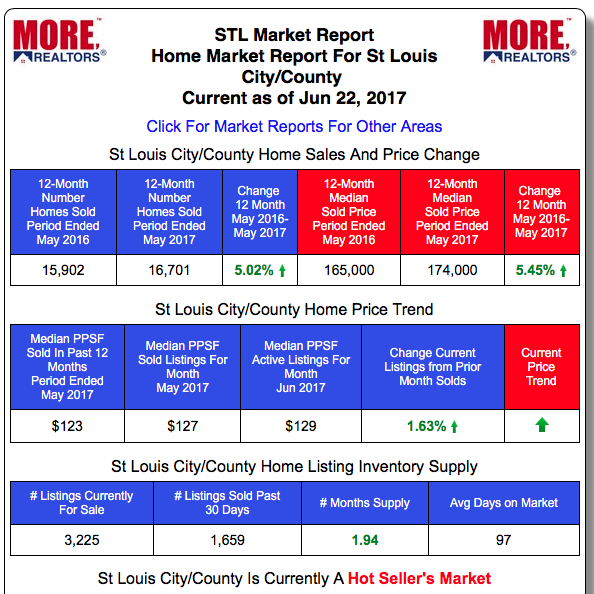
St Charles County Real Estate Market Home Prices and Home Sales – Past 12-Months vs Prior 12-month period
Jefferson County Real Estate Market Home Prices and Home Sales – Past 12-Months vs Prior 12-month period
Franklin County Real Estate Market Home Prices and Home Sales – Past 12-Months vs Prior 12-month period
