By Dennis Norman, on September 2nd, 2020 Yesterday, the Centers For Disease Control and Prevention (CDC) announced the issuance of an order temporarily halting all residential evictions in the United States through December 31, 2020. The CDC indicated this action was being taken “to prevent further spread of COVID-19”.
Details of the order….
Under the order, a landlord or other owner of residential property, “shall not evict any covered person from any residential property in any jurisdiction to which this Order applies during the effective period of the Order.” So, it’s pretty simple, if you own a residential property in the U.S. that has a tenant in it, this order applies to you. The only exception is the American Samoa, which, at the time of the order, had not cases of COVID-19 reported.
Tenants are still obligated for rental payments…
The order makes it clear that it does not remove the tenant’s obligations to pay rent, nor the landlord’s ability to charge late fees, penalties, etc. Specifically, the order states: “This order does not relieve any individual of any obligation to pay rent, make a housing payment, or comply with any other obligation that the individual may have under a tenancy, lease, or similar contract. Nothing in this Order precludes the charging or collecting of fees, penalties, or interest as a result of the failure to pay rent or other housing payment on a timely basis, under the terms of any applicable contract.”
Tenants must submit a declaration form to take advantage of this protection…
According to the order, for a tenant to receive the protection under this order, an executed copy of a Declaration form must be submitted to their landlord, owner, or property manager.
See the entire order here.
Download the Declaration Form for tenants here.
By Dennis Norman, on August 28th, 2020 Zombies are on the rise in St Louis! I’m referring, of course, to Zombie foreclosures and not the spooky creatures from scary movies. A zombie foreclosure is a property that is in “pre-foreclosure” meaning it is in the foreclosure process but has not been yet foreclosed upon and is vacant or abandoned by the current owner. We saw the levels of zombie foreclosures rise significantly after the housing bubble burst back in 2008 but then fall around 2012 as the market began its recovery. For the 3rd quarter of 2020, according to ATTOM Data Research, 10.8% of the homes in pre-foreclosure were vacant or otherwise known as “zombies foreclosures”. This is a fairly significant increase in the zombie rate from the prior quarter when 7.79% of the pre-foreclosures were vacant. A year ago, during the 3rd quarter of 2010, the zombie foreclosure rate was 7.77%.
St Louis vacant property rate rises during 3rd quarter as well..
As the table below also illustrates, 2.95% of the more than 1,000,000 residential properties in the St Louis MSA were vacant during the 3rd quarter of 2020 which is an increase from 2.88% for the 2nd quarter of 2020 as well as an increase from a year ago when the vacancy rate was 2.86%.
[xyz-ips snippet=”Foreclosures-For-Sale-and-Homes-For-Sale”]
St Louis Area Vacant Homes and Zombie Foreclosures

By Dennis Norman, on July 29th, 2020 The St Louis MSA rental vacancy rate during the 2nd quarter of 2020 was 4.4%, the lowest rate in over 15 years, according to data recently released by the U.S. Census Bureau. During the 2nd quarter of last year, the St Louis rental vacancy rate was 7.6%..
[xyz-ips snippet=”Foreclosures-For-Sale-and-Homes-For-Sale”]
St Louis Rental Vacancy Rates – 2005 – Present
(click on table for complete data from 2005 – present)”

By Dennis Norman, on June 17th, 2020 There were 542 homes “flipped” in the St Louis metro area during the first quarter of 2020, or 8.5% of the total number of homes sold in the St Louis metro area during the quarter, according to data just released by ATTOM Data Solutions. This is an increase of 13.8% from the prior quarter and is a decrease of 2% from a year ago. The median gross profit was 52,900 a 60.8% gross ROI.
Definition of a “flipped” home…
For the purposes of this report, a flipped home is considered to be any home or condo that was sold during the first quarter of this year in an arms-length sale that had previously had an arms-length sale within the prior 12 months. Since homeowners don’t tend to buy a home only to turn around and resell it within a year, when this does occur it is typically the result of an investor buying a property, renovating it, then reselling it.
[xyz-ips snippet=”Foreclosures-For-Sale-and-Homes-For-Sale”]
St Louis House Flipping – 1st Quarter 2020
 © 2019 – St Louis Real Estate News, all rights reserved © 2019 – St Louis Real Estate News, all rights reserved
By Dennis Norman, on April 4th, 2020 Need I answer? Given the title of this site and if you have been here before you probably are aware I’ve been in the real estate business ever since graduating high school some 41 years ago, I’m going to guess you know I’m going to say “of course it is”. On a more serious note though, my headline poses the question in light of the current Coronavirus pandemic which has resulted in a stay at home order for several counties in Missouri and, effective tomorrow night at midnight, the entire state of Missouri.
One of the exceptions in all of the stay at home orders has been for people working in “essential services” which in some of the orders is defined in detail and others in a more general fashion. In determining whether a business is essential there are many easy ones to figure out such as anything related to the medical or health industry, public safety, sanitation, etc. However, when it comes to other businesses such as those related to residential real estate such as agents, appraisers, home inspectors, loan officers, etc, it’s not always so clear. Locally, within the St Louis area whle real estate may not have been named specifically as an essential service, after legal review and discussion within the industry, it has been determined that real estate activities do in fact fall within the definition of essential services.
State of Missouri Stay at Home Order allows for real estate activities…
The stay at home order issued by the State of Missouri allows an exception for essential services but instead of defining what is included in those services, it defers to the guidance issued by the U.S.Department of Homeland Security. Included in the guidance as “essential functions” are “residential and commercial real estate services, including settlement services.”
Safety first…
Throughout the real estate industry, there has been much attention given to what functions can be safely done if CDC and other health and safety guidelines are adhered to, such as private showings of homes, and which ones should not be done such as a traditional open house with groups of people coming through. With these practices in place, along with utilizing technology for things such as virtual showings, agents have been able to serve their buyer and seller clients and facilitate sales.
Why it’s important…
I believe the inclusion of real estate activities as essential makes sense. For one, we are talking about a large segment of the population that is all, for the most part, small businesses as each real estate agent are their own business. They don’t get paid if they can’t carry out their real estate business, there are no salaries for agents. In addition, it’s not just the agents, it’s all the other professions involved in the transaction, building inspectors, lenders, title companies, survey companies, warranty companies, home repair, staging, movers and so on. So if we shut down residential real estate entirely we are shutting down a huge part of our economy and likely putting a ton of small businesses out of business.
Also, it’s more than just the livelihood of those involved. While some buyers are going to retreat from the market for now and wait until later, there are others that have reasons they need to move and want to buy. For example, there are still people getting married, moving into or out of town for a job, have growing families or other needs or motivations causing them to want to move now. For sellers, some may prefer to wait but for others, particularly those suffering financially from a job loss or business closing may be under the gun to get their home sold and really can’t wait.
So, just like workers in other essential services that are there to provide those needed services to their customers and clients, real estate agents are here to do the same for those people that do need to transact business during these challenging times.
[xyz-ips snippet=”Homes-For-Sale”]
By Dennis Norman, on April 2nd, 2020 The foreclosure rate for the St Louis MSA during February increased 22.55 percent from the prior month but declined 12.0% from February 2019, according to data just released from ATTOM Data Solutions. As the table below shows, only 3 counties in the St Louis metro area saw a decline in foreclosure activity in February from the month before but 10 of the 15 counties reported saw a decline in foreclosure activity from a year ago.
Three counties, Madison in Illinois and St Louis and Lincoln in Missouri, saw a decline in foreclosure activity from both the month before as well as the year before.
[xyz-ips snippet=”Foreclosures-For-Sale-and-Homes-For-Sale”]
St Louis MSA Foreclosures – February 2020

By Dennis Norman, on March 25th, 2020 As all of us continue to deal with a much different lifestyle as a result of the coronavirus pandemic (COVID-19) I am closely monitoring the St Louis real estate market to help get the most accurate information possible to our agents, clients, and consumers to help them make informed decisions about their real estate transactions.
With this in mind, I took a look at new contracts on listings for the past 7 days, so in other words, homes that actually went under contract during the period, but this time, I wanted to drill down deeper than I did a few days ago when I reported new contract activity. This time I looked at just new sales of residential listings (homes, condos, villas, etc) rather than all property types in the MLS as other property types, such as commercial, land, and farms, for example, could be reacting differently.
As the table below shows, there were 1,142 new contracts on residential listings in the St Louis MSA during the past 7 days, a decline of just 14% from the same time period a year ago. There were 836 new contracts on residential listings in the St Louis 5-County Core market during the same period, a decline of only 13% from the same period a year ago.
[xyz-ips snippet=”Seller-Resources—Listing-Targeted”]
St Louis New Contracts On Residential Listings For The Past 7 Days

A slower pace and different methods of selling homes…
As the data shows, COVID-19 is definitely having an effect on the St Louis real estate market in terms of a lower number of sales and, depending on how things go with containing the virus may bring sales down lower, but for now, the sales activity has been only modestly impacted. Granted, with the threat of COVID-19 many changes are being implemented into the process but thus far everyone in the industry is working together well to take the necessary precautions to address the health concerns while still allowing people to conduct business. For example, as much as can be done virtually or electronically is being done.
This is something our firm, MORE, REALTORS, has incorporated into our business model for well over a decade so for us and our agents, its a familiar and comfortable way for us to do business. It has caused us to switch into high gear to complete enhancements to our DOHR™ (Digital Open House Registration, U.S. Patent Pending) which include a totally virtual open house experience, a virtual showing experience as well as a hosted virtual tour experience. These are all things that will allow us to serve our seller clients by exposing their homes to the market, showing them to potential buyers while also protecting them and their families from exposure to the COVID-19 threat.
[xyz-ips snippet=”Seller-Resources—Listing-Targeted”]
By Dennis Norman, on March 21st, 2020 Yesterday, Michael D. Burton, Presiding Judge of the Circuity Court of St Louis County, signed an order that, until further notice, directed the St Louis County Sheriff’s office to “refrain from executing any writs of restitution (eviction of a tenant), writs of replevin, writs of attachment, writs of partition and any other writs of execution that require them to come into direct contact with the general public..”. In addition, putting a stop to evictions of tenants in St Louis County this order stops the additional actions listed as well but preventing evictions is probably the most significant part of the order.
[xyz-ips snippet=”Homes-For-Sale”]
By Dennis Norman, on March 18th, 2020 In response to the coronavirus pandemic, the U.S. Dept. of Housing and Urban Development (HUD), as well as the Federal Housing Finance Agency (FHFA) (which oversees Fannie Mae and Freddie Mac), directed their loan servicers to suspect foreclosures and evictions for at least 60 days to help those people affected.
In a statement, Mark Calabria, the Director of the FHFA, said that borrowers affected by the coronavirus who are having difficulty paying their mortgages should reach out to the mortgage servicers as soon as possible.
HUD Secretary Ben Carson said that “The halting of all foreclosure actions and evictions for the next 60 days will provide homeowners with some peace of mind during these trying times,”
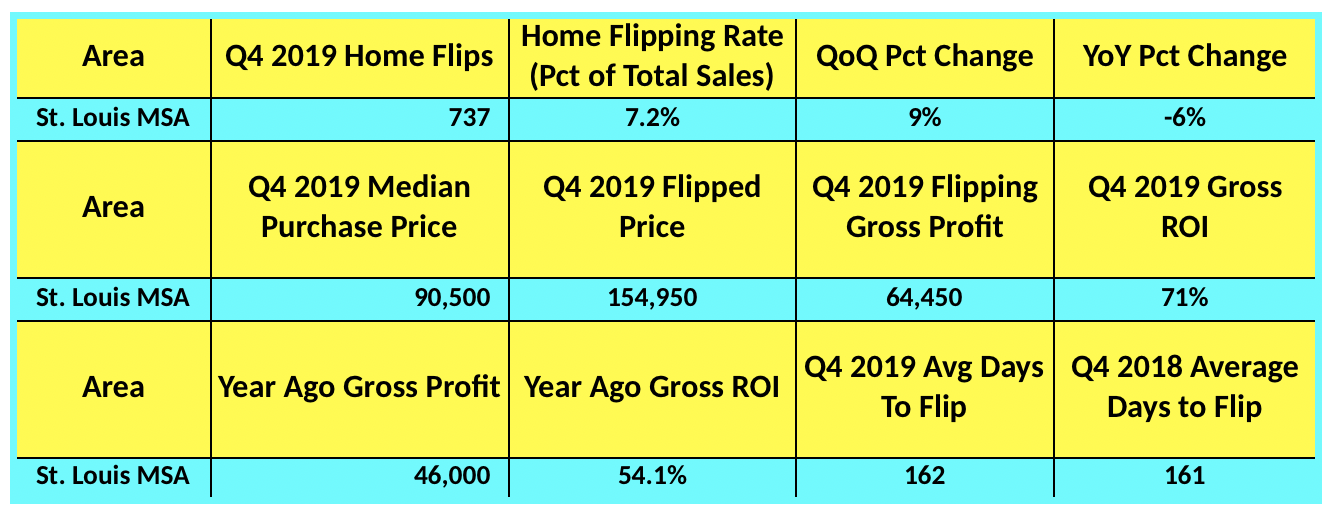
By Dennis Norman, on March 5th, 2020 There were 737 homes “flipped” in the St Louis metro area during the fourth quarter of 2019, or 7.2% of the total number of homes sold in the St Louis metro area during the quarter, according to data just released by ATTOM Data Solutions. This is an increase of 9% from the prior quarter and is a decrease of 6% from a year ago. The median gross profit was 64.450 a 71% gross ROI and a significant increase from a year ago when the Gross ROI was 54.1%.
Definition of a “flipped” home…
For the purposes of this report, a flipped home is considered to be any home or condo that was sold during the first quarter of this year in an arms-length sale that had previously had an arms-length sale within the prior 12 months. Since homeowners don’t tend to buy a home only to turn around and resell it within a year, when this does occur it is typically the result of an investor buying a property, renovating it, then reselling it.
[xyz-ips snippet=”Foreclosures-For-Sale-and-Homes-For-Sale”]
St Louis House Flipping – 4th Quarter 2019
 © 2019 – St Louis Real Estate News, all rights reserved © 2019 – St Louis Real Estate News, all rights reserved
By Dennis Norman, on February 24th, 2020 Thanks to a booming economy and strong housing market, distressed home sales in the St Louis Metro Area declined by nearly 25 percent (23.42%) in the 12-month period ended January 31, 2020 from the prior 12-month period. As our exclusive, STL Market Report below shows, there were 1,887 distressed home sales (foreclosures, REO’s and short sales)in the most recent 12-month period compared with 2,464 in the prior 12-month period. The median home price of the distressed homes sold declined 1.79% during the same period, from a median price of $56,000 in the prior period to $55,000 in the most recent period.
[xyz-ips snippet=”Foreclosures-For-Sale-and-Homes-For-Sale”]
Distressed Home Sales St Louis MSA
(Foreclosures-REO’s-Short Sales) – Past 12 Months vs Prior 12 Months
(click on table for current report)

By Dennis Norman, on February 23rd, 2020 Let me begin with this is not a political statement and the purpose of this site is not about politics but about real estate. Having said that, this morning I came across the plans for the housing market that Bernie Sanders is proposing if he is elected President which I had not seen before. Upon reviewing his plan (it is on his official site) I realized that while many of the components of it sound good (like “End homelessness and ensure fair housing for all”) many of his promises in this area sound like things that would negatively impact investors and the housing market as a whole.
The following are the Key Points to the Bernie Sanders housing plan from his website (I have included the complete list):
- End the housing crisis by investing $2.5 trillion to build nearly 10 million permanently affordable housing units.
- Protect tenants by implementing a national rent control standard, a “just-cause” requirement for evictions, and ensuring the right to counsel in housing disputes.
- Make rent affordable by making Section 8 vouchers available to all eligible families without a waitlist and strengthening the Fair Housing Act.
- Combat gentrification, exclusionary zoning, segregation, and speculation.
- End homelessness and ensure fair housing for all
- Revitalize public housing by investing $70 billion to repair, decarbonize, and build new public housing.
Under the “When Bernie is president, he will” section are some of the things he plans to do to accomplish the above goals (this list is rather extensive on his site so I have only included a sampling of the items that appear will negatively impact investors and homeowners):
- Enact a national cap on annual rent increases at no more than 3 percent or 1.5 times the Consumer Price Index (whichever is higher) to help prevent the exploitation of tenants at the hands of private landlords.
- Allow states and cities to pass even stronger rent control standards.
- Implement a “just-cause” requirement for evictions, which would allow a landlord to evict a tenant only for specific violations and prevent landlords from evicting tenants for arbitrary or retaliatory reasons.
- Place a 25 percent House Flipping tax on speculators who sell a non-owner-occupied property, if sold for more than it was purchased within 5 years of purchase.
- Impose a 2 percent Empty Homes tax on the property value of vacant, owned homes to bring more units into the market and curb the use of housing as speculative investment.
Again, this is not a political piece, but given the strong housing market we have enjoyed over the past several years, which has helped many Americans build equity and recover wealth lost during the housing bubble burst of 2008, I think it’s worth noting proposed plans, by any party or power, that could negatively impact the market. Also, these are just talking points from someone running for office, so whether it’s Bernie Sanders or any other candidate, or even the current President, Donald J. Trump, they can all have ideas but getting them implemented takes cooperation of Congress and that is not always so easy so it doesn’t mean any of their plans ever actually come to fruition.
By Dennis Norman, on February 14th, 2020 As you may have noticed, I’ve been pretty optimistic about the outlook for the real estate market this year however, that is not always the case as I call it like I see it. The reason for my optimism is based upon what a true data geek like myself would base it upon, data! So, what’s the data that has me believing 2020 will be a good year for the housing market in St Louis and beyond? Several things:
- As I have been reporting here for the past couple of years now, mortgage delinquency and foreclosure rates have continued to decline which show the strength of the economy as a whole as well as the housing industry.
- As the US Economic Indicators charts below show, since peaking around 2010, the unemployment rate, 30-year mortgage rate and mortgage delinquency rates have all steadily declines to either record lows or at least the lowest rate in recent history.
- As the St Louis unemployment, home prices and rent chart below shows, unemployment in St Louis has fallen to the lowest level in decades and the relationship between home prices and rents show home prices lagging behind rents indicating that we’ll likely see continued, good housing appreciation rates.
- As the 30-year fixed rate mortgage chart below shows, mortgage rates are at near record low rates giving buyers much more buying power. In my market update video I shared here a day or two ago I illustrate just how much more buying power this translates into.
- As I reported last week, St Louis home sales last year managed to top the prior year slightly, in spite of the low-inventory market we have been stuck in. This shows the demand that is out there.
- As I reported earlier this week, the home sales trend for 2020 in St Louis is in positive territory has well.
Continue reading “Why I’m Bullish On Real Estate For 2020“
By Dennis Norman, on February 6th, 2020 During the fourth quarter of 2019, 10.2% of the homeowners in St Louis with a mortgage, were underwater on their mortgage, meaning they were in a negative-equity position, according to data just released by ATTOM Data Research. As the table below shows, this is the lowest level of St Louis homeowners that are seriously underwater since 2013 when this data was first tracked. This continues the trend that began in the price quarter with the then lowest rate at 10.5%.
St Louis Underwater (Negative-Equity) Homeowners
(Click on table for live, complete data from 2013-Present)
 Homeowners")
By Dennis Norman, on January 16th, 2020 Foreclosure rates and mortgage delinquency rates have steadily declined over the past couple of years as the housing market, as well as the overall economy, have both continued to improve and thrive. Nonetheless, foreclosures still take place and during 2019 the St Louis MSA had the 8th highest foreclosure rate of the 20 largest MSAs, according to the latest data released by Attom Data Solutions.
As the table below shows, during 2019, in the St Louis MSA there was 1 foreclosure action for every 232 housing units. Philadelphia, PA, had the highest foreclosure rate of the 20-largest MSAs with one foreclosure action for every 133 housing units and San Francisco had the lowest with one foreclosure action for every 631 housing units.
[xyz-ips snippet=”Foreclosures-For-Sale-and-Homes-For-Sale”]
2019 Foreclosure Rates – 20 Largest MSAs
 Copyright 2020 – St Louis Real Estate News – All rights reserved – Data Source ATTOM Data Solutions
By Dennis Norman, on December 16th, 2019 The foreclosure rate for the St Louis MSA during October decreased 6.0 percent from the month and was down 4.2% from November 2018, according to data just released from ATTOM Data Solutions. As the table below shows, there were, like last month, some mixed results. For example, St Charles County saw a 20% increase in foreclosures from the month before while the City of St Louis saw a 27% decrease from the month before. The U.S. as a whole saw a bigger decline in foreclosure activity than the St Louis MSA did.
[xyz-ips snippet=”Foreclosures-For-Sale-and-Homes-For-Sale”]
St Louis MSA Foreclosures – November 2019

By Dennis Norman, on December 12th, 2019 There were 762 homes “flipped” in the St Louis metro area during the third quarter of 2019, or 6.3% of the total number of homes sold in the St Louis metro area during the quarter, according to data just released by ATTOM Data Solutions. This is a decline of 15% from the prior quarter as well as a 5% decrease from the prior year. As our table below shows, on a national level, house flipping accounted for just 5.4% of the homes sold during the 3rd quarter of this year, which is a 9% decrease from the quarter before and a 4% increase from a year ago.
Definition of a “flipped” home…
For the purposes of this report, a flipped home is considered to be any home or condo that was sold during the first quarter of this year in an arms-length sale that had previously had an arms-length sale within the prior 12 months. Since homeowners don’t tend to buy a home only to turn around and resell it within a year, when this does occur it is typically the result of an investor buying a property, renovating it, then reselling it.
[xyz-ips snippet=”Foreclosures-For-Sale-and-Homes-For-Sale”]
St Louis House Flipping – 3rd Quarter 2019
 © 2019 – St Louis Real Estate News, all rights reserved © 2019 – St Louis Real Estate News, all rights reserved
By Dennis Norman, on November 14th, 2019 The foreclosure rate for the St Louis MSA during October increased 11.3 percent from the month before however, it was still nearly 25 percent (24.5%) lower than October 2018, according to data just released from ATTOM Data Solutions. As the table below shows, there were some real mixed results this month. For example, St Charles County saw a 150% increase in foreclosures from the month before increasing from 10 in September to 25 in October but is down over 60% from October 2018. The city of St Louis is the only county of significant size in the St Louis MSA that saw both an increase in foreclosures from the month before (65.8^) as well as an increase from a year ago (43.2%).
[xyz-ips snippet=”Foreclosures-For-Sale-and-Homes-For-Sale”]
St Louis MSA Foreclosures – October 2019

By Dennis Norman, on November 9th, 2019 During the third quarter of 2019, 10.5% of the homeowners in St Louis with a mortgage, were underwater on their mortgage, meaning they were in a negative-equity position, according to data just released by ATTOM Data Research. As the table below shows, this is the lowest level of St Louis homeowners that are seriously underwater since 2013 when this data was first tracked.
St Louis Underwater (Negative-Equity) Homeowners – 2013-2019
 Homeowners - 2013-2019")
By Dennis Norman, on November 1st, 2019 The St Louis MSA rental vacancy rate during the 3rd quarter of this year was 10.6%, an increase from 7.6% the prior quarter and the highest rate since the 1st quarter of 2016 when the rate was 12.2%, according to data recently released by the U.S. Census Bureau. Last year, the median rental vacancy rate for the St Louis MSA for the year was 6.8%, a 13 year low.
[xyz-ips snippet=”Foreclosures-For-Sale-and-Homes-For-Sale”]
St Louis Rental Vacancy Rates – 2016 – Present
(click on table for complete data from 2005 – present)
By Dennis Norman, on October 18th, 2019 The St Louis foreclosure rate during the 3rd quarter of this year was 1 in every 766 housing units, a decline of nearly 1% from the prior quarter and a decline of over 27% from a year ago, according to data just released from ATTOM Data Solutions. As the table below shows, 6 of the counties in the St Louis MSA saw an increase in the foreclosure rate during the 3rd quarter from the prior quarter and only two counties saw an increase from a year ago.
[xyz-ips snippet=”Foreclosures-For-Sale-and-Homes-For-Sale”]
St Louis MSA Foreclosures – 3rd Quarter 2019

By Dennis Norman, on October 15th, 2019 St Louis is the top marketing for flipping homes, according to an article published yesterday on Realtor.com. It’s not all just flipping activity however in the article a very notable and credible St Louis industry source (unabashed self-promotion) stated that “flipping is more common in homes in the $175,000-plus range, while many of those listed for $125,000 and less are being turned into rentals, says Norman.”
The Realtor.com article gave an overview of the market data I produced for them so I wanted to share the market data behind the overview.
St Louis Neighborhoods With Large Investor Presence:
- 63137 Zip Code Area (Bellefontaine Neighbors/Glasgow Village) – 43.5% of housing units are investor-owned
- 63135 Zip Code Area (Ferguson) – 39.2% of housing units are investor-owned
- 63033 Zip Code Area (Florissant Area) – 21.8% of housing units are investor-owned
Home Prices In St Louis’ Active Investor Markets:
Continue reading “St Louis Is Number One Market For Flipping Homes“
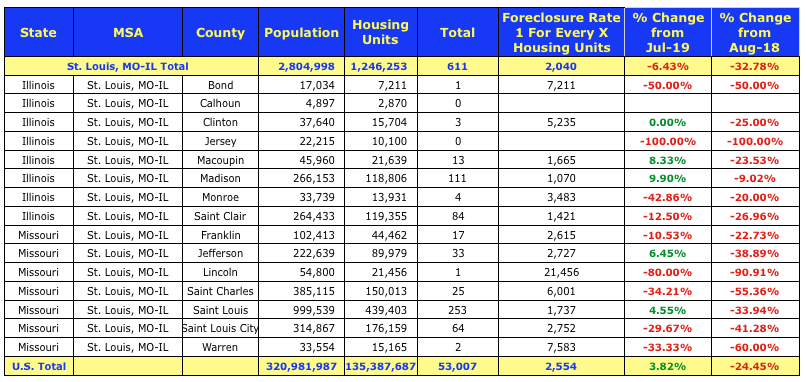
By Dennis Norman, on September 14th, 2019 During August there was one foreclosure action for every 2,040 housing units in the St Louis MSA, a decline of 6.43% from the month before and a decline of 32.78% from a year ago, according to data just released from ATTOM Data Solutions. As the table below shows, only 4 of the counties in the St Louis MSA saw an increase in the foreclosure rate for August 2019 from the month before, but all counties saw a decline from August 2018.
[xyz-ips snippet=”Foreclosures-For-Sale-and-Homes-For-Sale”]
By Dennis Norman, on August 7th, 2019 The rate of foreclosure in St Louis during the 2nd quarter of this year was 1 foreclosure filing for every 759 housing units, a decrease of 15.68% from the prior quarter and a decline of 18.54% from the 2nd quarter of 2018, according to data just released by ATTOM Data Research. St Louis has the 73rd highest foreclosure rate of the 220 MSA’s ranked in the report.
As the table below shows, only three counties in the St Louis MSA saw an increase in foreclosure activity this quarter from the prior quarter and, with the exception of Lincoln County, none saw an increase from a year ago.
[xyz-ips snippet=”Foreclosures-For-Sale-and-Homes-For-Sale”]
St Louis MSA Foreclosure Rate By County – 2nd Quarter 2019

Data Source: ATTOM Data Solutions -©2019 St Louis Real Estate News – All Rights Reserved
By Dennis Norman, on June 13th, 2019 The rate of foreclosure in St Louis in May was 1 foreclosure filing for every 2,013 housing units, an increase of 7.7% from the month before but a decline of 18.8% from May 2018, according to data just released by ATTOM Data Research.
As the table below shows, six counties in the St Louis MSA saw an increase in foreclosure activity in May from the month before however, all the counties in the St Louis MSA except 3, saw a decline from a year ago.
[xyz-ips snippet=”Foreclosures-For-Sale-and-Homes-For-Sale”]
St Louis MSA Foreclosure Rate By County – May 2019

Data Source: ATTOM Data Solutions -©2019 St Louis Real Estate News – All Rights Reserved
By Dennis Norman, on June 8th, 2019 A bill introduced by St Louis County Councilmember Lisa Clancy would require landlords in unincorporated St Louis County to participate in the Section 8 program as well as pretty much any other rental subsidy program. St Louis County bill number 102 (see complete bill at bottom of article), introduced by Councilmember Clancy, if passed, would amend the existing St Louis County “Fair Housing Code” ordinance adding “lawful source of income” to the list of things that a landlord cannot discriminate based upon.
The St Louis County Fair Housing Ordinance (section 717.020) currently makes it unlawful for landlords to discriminate on the basis of race, color, religion, national origin, gender, disability, sexual orientation, gender identity, or familial status. Currently included in the protected classes under St Louis County law, which are not included in the Federal Fair Housing Act, are “sexual orientation” and “gender identity”. In addition, St Louis County has “gender” as a class instead of “sex” as is in the Federal Fair Housing Act. If St Louis County Council bill 102 passes and becomes an ordinance, then “lawful source of income” will be an additional protected class and will be another one that is not in the Federal Fair Housing Act.
There are other municipalities, counties, and states around the country that have passed similar legislation as well. As to be expected, legislation like this has been met with a mixed response.
Is it discriminatory for a landlord to refuse to accept Section 8, Vouchers and the like? Continue reading “Proposed St Louis County Ordinance Would Require Landlords To Accept Section 8“
By Dennis Norman, on June 6th, 2019 There were 528 homes “flipped” in the St Louis metro area during the first quarter of 2019, which equated to 7.7% of the total number of homes sold in the St Louis metro area during the quarter, according to data just released by ATTOM Data Research. This is down 14% from the 1st quarter of 2018 but does reflect a 3% increase from the prior quarter. As our table below shows, on a national level, house flipping accounted for 7.2% of the homes sold during the 1st quarter of this year, which is a 23% increase from the quarter before and an 8% increase from a year ago.
Definition of a “flipped” home…
For the purposes of this report, a flipped home is considered to be any home or condo that was sold during the first quarter of this year in an arms-length sale that had previously had an arms-length sale within the prior 12 months. Since homeowners don’t tend to buy a home only to turn around and resell it within a year, when this does occur it is typically the result of an investor buying a property, renovating it, then reselling it.
[xyz-ips snippet=”Foreclosures-For-Sale-and-Homes-For-Sale”]
St Louis House Flipping – 1st Quarter 2019

By Dennis Norman, on May 21st, 2019 The strong St Louis housing market, as well as the strong economy, continues to help improve mortgage delinquency rates and foreclosure rates in St Louis. The rate of foreclosure in St Louis in April was 1 foreclosure filing for every 2,167 housing units, a decline of 17.4% from the month before when the rate was 1 in every 1,865 housing units, according to the latest data from ATTOM Data Solutions. The April St Louis foreclosure rate was down 17.9% from the year before.
As the table below shows, over half the counties in the St Louis MSA saw an increase in foreclosure activity in April from the month before, all in the double-digits, however, with the exception of the city of St Louis, all of the larger counties saw a decline from the month before.
[xyz-ips snippet=”Foreclosures-For-Sale-and-Homes-For-Sale”]
St Louis MSA Foreclosure Rate By County – April 2019

Data Source: ATTOM Data Solutions -©2019 St Louis Real Estate News – All Rights Reserved
By Dennis Norman, on May 12th, 2019 The St Louis MSA rental vacancy rate during the 1st quarter of this year was 8.1%, an increase from 6.6% the prior quarter, according to data recently released by the U.S. Census Bureau. Given that for 2018 the median rental vacancy rate of 6.8% in the St Louis MSA was a 13 year low, it’s not surprising we may see an uptick in vacancies.
As the table below shows, the rental vacancy rate for the St Louis MSA for the first quarter of 2018 was 9.6% and then fell to 5.6% during the 2nd quarter so perhaps we’ll see a repeat of that this year as well but time will tell.
[xyz-ips snippet=”Foreclosures-For-Sale-and-Homes-For-Sale”]
St Louis Rental Vacancy Rates – 2016 – Present
(click on table for complete data from 2005 – present)

By Dennis Norman, on May 8th, 2019 During the first quarter of 2019, 14.5% of the homeowners in St Louis with a mortgage, were underwater on their mortgage, meaning they were in a negative-equity position, according to data just released by ATTOM Data Research. As the table below shows, this slight increase follows a decline in the rate for the two prior quarters. The St Louis negative-equity rate is about one and a half times that for the U.S. as a whole.
St Louis Underwater (Negative-Equity) Homeowners – 2013-2019
 Homeowners - 2013-2019")
|
Recent Articles
|

