By Dennis Norman, on May 18th, 2015 The mortgage delinquency rate (home owners that are 60 days or more delinquent on mortgage payment) dropped to 2.95 percent in the first quarter of 2015, marking the first time the mortgage delinquency rate has been below 3 percent since the 3rd quarter of 2007 when the rate was 2.61 percent, according to a report released this morning by TransUnion. This is also the 13th consecutive quarter the mortgage delinquency rate has declined from the prior quarter.
Subprime delinquency rate is over 9 times higher…
The report also shows that the mortgage delinquency rate for subprime borrowers fell in the first quart of this year as well, down to 27.23 percent from 29.76 percent during the prior quarter. Even with the improvement, the mortgage delinquency rate for subprime borrowers is still over 9 times greater than for borrowers overall. This is a great improvement from the peak however, in the first quarter of 2010, when the rate was 40.48 percent for subprime borrowers.
(We work hard on this and sure would appreciate a “Like”)[iframe http://www.facebook.com/plugins/like.php?href=https%3A%2F%2Fwww.facebook.com%2FStLouisRealEstateNews&send=false&layout=standard&width=50&show_faces=false&font&colorscheme=light&action=like&height=35&appId=537283152977556 100 35 ]
Search St Louis Homes For Sale HERE
See ALL Homes That Will Be Open In St Louis This Weekend Continue reading “Mortgage Delinquency Rates Drop To Pre-Bubble Level“
By Dennis Norman, on May 7th, 2015 Flipping homes accounts for a smaller percentage of home sales today at about 4 percent of total home sales in the U.S., then in the recent past when they accounted for 6 percent of more of the homes being sold (6.8% at the recent peak in 1st quarter 2012), according to a report released today by RealtyTrac.
According to RealtyTrac, Baltimore Maryland is the best place to flip homes based upon the gross profit margin calculated as a return on investment (ROI) coming with a 94.1% ROI! Before you get too excited, don’t think that is what the investor walked away with, the gross margin is just based upon the difference between the purchase price and sale price and does not take into account any expenses for remodeling, resale, etc. As the table below shows, the next 4 out of 5 cities at the top of the list can all be found in Florida.
Memphis Tennessee is the metro area with the highest percentage of flips with home flipping accounting for over 10 percent (10.6%) of all the home sales. The table at the bottom lists the 20 markets with the highest percentage of flipping.
(We work hard on this and sure would appreciate a “Like”)[iframe http://www.facebook.com/plugins/like.php?href=https%3A%2F%2Fwww.facebook.com%2FStLouisRealEstateNews&send=false&layout=standard&width=50&show_faces=false&font&colorscheme=light&action=like&height=35&appId=537283152977556 100 35 ]
Search St Louis Homes For Sale HERE
See ALL Homes That Will Be Open In St Louis This Weekend
Want to flip property? Check out my video on how to buy foreclosures here. Continue reading “Baltimore Tops List Of Metros For Highest Returns From Flipping Homes“
By Dennis Norman, on May 6th, 2015 House flipping in St Louis accounted for just 2.4 percent of the home sales in the St Louis metro area during the first quarter of this year, according to data just obtained from RealtyTrac. This is a decline a 69 percent from a year ago when “flips” accounted for 7.7 percent of all St Louis home sales.
Highlights from the 1st Quarter 2015 report:
- There were 115 house flips during the 1st quarter of 2015
- This was a 57% decline from the prior quarter and a 69% decline from the 1st quarter of 2014
- Average days to flip a home during the quarter was 169
- Average purchase price was $79,398, average sale price $101,495
- Average gross margin on flips during the quarter was 22%
- Average gross return on investment during the quarter was 27.8% which is down from 47.9% a year ago
(We work hard on this and sure would appreciate a “Like”)[iframe http://www.facebook.com/plugins/like.php?href=https%3A%2F%2Fwww.facebook.com%2FStLouisRealEstateNews&send=false&layout=standard&width=50&show_faces=false&font&colorscheme=light&action=like&height=35&appId=537283152977556 100 35 ]
Search St Louis Homes For Sale HERE
See ALL Homes That Will Be Open In St Louis This Weekend
Want to flip property? Check out my video on how to buy foreclosures here.
By Dennis Norman, on April 29th, 2015 Distressed home sales (foreclosures, REO’s and short sales) made up 13.5 percent of the home sales in the U.S. in February, 2015, a decline of 18% from a year ago when the rate was 16.5 percent and is a decline of 5.6% from January when the rate was 14.3%, according to a report just released by Corelogic. The rate of distressed home sales in February 2015 marks the lowest rate for the month of February since February 2008, according to the report.
REO Sales down almost two-thirds from peak
During the peak, January 2009, distressed home sales accounted for 32.4 percent of al home sales with REO sales making up 27.9% of that share. In February, 2015, REO sales accounted for 9.7 percent of all home sales, a decline of nearly two-thirds (65.23%).
Short Sales down only slightly
Quite different than the figures for REO sales, short sales accounted for 4.5% of all home sales back in January 2009 and still accounted for 3.8% of them in February 2015, for a decline of just 15.6% percent.
Still far from “normal”
Even with the declines, we are a far way from “normal”….prior to the real estate market crisis, distressed home sales made accounted for just about 2% of home sales so we still have a long way to go.
Michigan is the king of distress (We work hard on this and sure would appreciate a “Like”)[iframe http://www.facebook.com/plugins/like.php?href=https%3A%2F%2Fwww.facebook.com%2FStLouisRealEstateNews&send=false&layout=standard&width=50&show_faces=false&font&colorscheme=light&action=like&height=35&appId=537283152977556 100 35 ]
Search St Louis Homes For Sale HERE
See ALL Homes That Will Be Open In St Louis This Weekend Continue reading “Distressed Home Sales In February Fall Back to 2008 Rate“
By Dennis Norman, on April 21st, 2015 Between 2006 and 2014 nearly 9.3 million homeowners in the U.S. were either foreclosed on, did a deed of lieu of foreclosures, or did a short sale of their home, according to a recent report by the National Association of REALTORS (NAR). Here in Missouri, there were 158,000 foreclosures or distressed sales during that same period.
According to the NAR report titled “Return Buyers” Many Already Here, Many More to Come”, almost one million (950,000) of the 9.3 million people that lost their home, or did a distressed sale, have already likely purchased a home again, however an additional 1.5 million return-buyers will likely purchase a home in the next five years. In Missouri, NAR estimates that 21,000 of the 158,000 homeowners that lost their homes in foreclosure, did a deed in lieu or short-sold their home have already purchased another home, however predicts that there are 30,000 more in Missouri that will be a return buyer from now until 2023.
(We work hard on this and sure would appreciate a “Like”)[iframe http://www.facebook.com/plugins/like.php?href=https%3A%2F%2Fwww.facebook.com%2FStLouisRealEstateNews&send=false&layout=standard&width=50&show_faces=false&font&colorscheme=light&action=like&height=35&appId=537283152977556 100 35 ]
Search St Louis Homes For Sale HERE
See ALL Homes That Will Be Open In St Louis This Weekend Continue reading “Twenty Percent Of Homeowners That Did Distressed Sales Expected To Return As Buyer in Coming Decade“
By Dennis Norman, on April 17th, 2015 Foreclosure activity in St Louis was on the rise in March with the foreclosure rate for the St Louis metro area increasing 14 percent from a year ago and over 64 percent from February, according to the latest data from RealtyTrac. As the chart below shows, foreclosure activity for the larger Missouri counties that are included in the St Louis MSA saw foreclosure actions decline from a year ago with the exception of Franklin County which saw a big increase.
(We work hard on this and sure would appreciate a “Like”)[iframe http://www.facebook.com/plugins/like.php?href=https%3A%2F%2Fwww.facebook.com%2FStLouisRealEstateNews&send=false&layout=standard&width=50&show_faces=false&font&colorscheme=light&action=like&height=35&appId=537283152977556 100 35 ]
Search St Louis Foreclosures For Sale HERE
Search St Louis Homes For Sale HERE
Continue reading “St Louis Foreclosures Rise In March“
By Dennis Norman, on April 1st, 2015 Seriously underwater homeowners, those people whose mortgage debt is 125 percent or more of their current home’s value, increased to 13.2% of all home loans during the 1st quarter of 2015, marking the first increase in rate from the prior quarter since February 2012, according to a report released this morning from RealtyTrac. As the chart below shows, the percentage of homeowners that are seriously underwater, peaked during the 2nd quarter of 2012 at 28.6% and has decreased every quarter until reaching the most recent low of 12.7% during the 4th quarter of last year.
(We work hard on this and sure would appreciate a “Like”)[iframe http://www.facebook.com/plugins/like.php?href=https%3A%2F%2Fwww.facebook.com%2FStLouisRealEstateNews&send=false&layout=standard&width=50&show_faces=false&font&colorscheme=light&action=like&height=35&appId=537283152977556 100 35 ]
Search St Louis Homes For Sale HERE
See ALL Homes That Will Be Open In St Louis This Weekend Continue reading “Percentage of Underwater Homeowners Increases For First Time In Nearly Three Years“
By Dennis Norman, on March 19th, 2015 St Louis foreclosures declined in February for the St Louis MSA with a total of 843 foreclosure actions occurring during the month, a decline of over 22 percent from the month before and a decline of over 10 percent from a year ago, according to data just released this morning by RealtyTrac.
As the table below shows, foreclosure activity decreased in all of the counties in the core St Louis market during February from the month before and all, except Franklin County, saw a decrease from a year ago.
On a national level, RealtyTrac reported 101,938 foreclosure actions occurred during the month of February in the U.S., a decline of 4% from January, a decline of 9% from February 2014, and the lowest level since July 2006.
(We work hard on this and sure would appreciate a “Like”)[iframe http://www.facebook.com/plugins/like.php?href=https%3A%2F%2Fwww.facebook.com%2FStLouisRealEstateNews&send=false&layout=standard&width=50&show_faces=false&font&colorscheme=light&action=like&height=35&appId=537283152977556 100 35 ]
Search St Louis Foreclosures For Sale HERE
Search St Louis Homes For Sale HERE
Continue reading “St Louis Foreclosures Decline In February“
By Dennis Norman, on March 10th, 2015 If you are like a lot of people and see St Louis foreclosures, or REO’s (real estate owned by banks and other lending institutions as a result of foreclosure) as a good opportunity to buy a residence for yourself or as an investment either for rental or for “flipping”, you best have cash and be prepared to “buck up” if you want to succeed! I say this because cash buyers continue to dominate the REO and foreclosure market with 61% of all REO and Foreclosure sales this year in St Louis being cash sales thus far. As the table below shows, while the number of foreclosure sales has declined this year from last year at the same time, the percentage of them going to cash buyers has not.
Good deals on St Louis foreclosures are selling fast and often for list price or more.
For the month of February, in the five county core St Louis market (city of St Louis and counties of St Louis, St Charles, Jefferson and Franklin) there were 273 foreclosure or REO homes sold and they were sold, on average, at 98% of list price. If we drill down a little and find the “best” deals out of the gate, the ones that sell in the first 10 days, there were 48 foreclosure homes sold in February (18% of the overall total number of foreclosures sold) and they sold, on average, for 105% of the list price.
So, if you are planning on buying St Louis foreclosures, cash is king and, for the new deals that hit the market with an attractive price, realize that even a full price offer may not buy it. For some personal advice from me on how to be successful buying St Louis Foreclosures and REO’s, read my report here.
(We work hard on this and sure would appreciate a “Like”)[iframe http://www.facebook.com/plugins/like.php?href=https%3A%2F%2Fwww.facebook.com%2FStLouisRealEstateNews&send=false&layout=standard&width=50&show_faces=false&font&colorscheme=light&action=like&height=35&appId=537283152977556 100 35 ]
Search St Louis Foreclosures For Sale HERE
Search St Louis Homes For Sale HERE
 Sales Through End of February- Number of Cash Sales")
By Dennis Norman, on February 27th, 2015
Two zip codes in the city of St Louis made RealtyTrac’s list of “Zips with the highest gross returns (from flipping property)” for 4th quarter, 2014. The 63139 zip code, which includes the Dog Town area of St Louis, came in number 2 on the list with an average gross return on investment of 163.9% and the 63116 zip code, which includes Tower Grove South, Holly Hills, Dutchtown South and Bevo, came in 9th on the list with an average gross return on investment of 127.7%.
To be eligible to be considered for the list, there had to be at least 10 single family homes “flips” completed during the 4th quarter of 2014. In the 63139 area of St Louis, there were 18 such home flips during the quarter with an average purchase price of $9,000 and an average gross profit of $14,750 from the flip. In the 63116 zip area, there were 21 flips during the quarter with an average purchase price of $27,721 and an average gross profit of $35,407. The table below shows the data for all 10 top gross returns from flipping property zips in the U.S.
(We work hard on this and sure would appreciate a “Like”)[iframe http://www.facebook.com/plugins/like.php?href=https%3A%2F%2Fwww.facebook.com%2FStLouisRealEstateNews&send=false&layout=standard&width=50&show_faces=false&font&colorscheme=light&action=like&height=35&appId=537283152977556 100 35 ]
Search St Louis Homes For Sale HERE
See ALL Homes That Will Be Open In St Louis This Weekend
Want to flip property? Check out my video on how to buy foreclosures here.
Continue reading “Two St Louis Areas were the most profitable zips in the U.S. for flipping property in 4th quarter“
By Dennis Norman, on February 12th, 2015 St Louis foreclosures increased dramatically in January with 1,116 foreclosure actions in the St Louis metro area during the month, an increase of 52.25 percent from December and an increase of 47.42 percent from January 2014, according to data just released this morning by RealtyTrac.
As the table below shows, all of the counties in the core St Louis market saw an increase in foreclosure activity during January from the month before and all, except Jefferson County, saw an increase from a year ago.
On a national level, RealtyTrac is reporting that foreclosure activity in January increased 5 percent from December but declined 4 percent from January 2014.
(We work hard on this and sure would appreciate a “Like”)[iframe http://www.facebook.com/plugins/like.php?href=https%3A%2F%2Fwww.facebook.com%2FStLouisRealEstateNews&send=false&layout=standard&width=50&show_faces=false&font&colorscheme=light&action=like&height=35&appId=537283152977556 100 35 ]
Search St Louis Foreclosures For Sale HERE
Search St Louis Homes For Sale HERE
Continue reading “St Louis Foreclosures Increase In January Nearly 50 Percent From Year Before“
By Dennis Norman, on February 10th, 2015 St Louis had 6,215 completed foreclosures in 2014 putting it 7th on the list of metros in the U.S. in terms of the number of completed foreclosures. As the table below, which lists the 25 top metro areas for foreclosures, shows, Tampa saw the most foreclosures with over 18,000 being completed during 2014, according to newly released data from Corelogic.
According to the Corelogic report, there were 563,294 completed foreclosures in the U.S. during 2014, the lowest total for any 12 month period since November 2007 when it was 589,570.
(We work hard on this and sure would appreciate a “Like”)[iframe http://www.facebook.com/plugins/like.php?href=https%3A%2F%2Fwww.facebook.com%2FStLouisRealEstateNews&send=false&layout=standard&width=50&show_faces=false&font&colorscheme=light&action=like&height=35&appId=537283152977556 100 35 ]
Search St Louis Foreclosures For Sale HERE
Search St Louis Homes For Sale HERE
Continue reading “St Louis Ranked Seventh In Number of Completed Foreclosures In 2014“
By Dennis Norman, on February 6th, 2015 Over half (51%) of the foreclosures in St Louis are “Zombies” meaning that the owners have abandoned or vacated their home prior to their lender completing the foreclosure process, according to a report released this morning by RealtyTrac. Just like the number of St Louis foreclosures is down significantly from a year ago, the actual number of Zombie foreclosures has declined 59% from a year ago.
The chart below shows zombie foreclosure data for the 10 metro areas in the U.S. with the highest percentage of Zombie foreclosures. Beneath that is a table showing the 10 metro in the U.S. with the most number of Zombie foreclosures which shows New York leads the nation with over 19,000 zombie foreclosures as well as a chart showing the States with the highest number of Zombies.
(We work hard on this and sure would appreciate a “Like”)[iframe http://www.facebook.com/plugins/like.php?href=https%3A%2F%2Fwww.facebook.com%2FStLouisRealEstateNews&send=false&layout=standard&width=50&show_faces=false&font&colorscheme=light&action=like&height=35&appId=537283152977556 100 35 ]
Search St Louis Foreclosures For Sale
Search St Louis Homes For Sale HERE
Continue reading “Over Half Of St Louis Foreclosures Are Zombies – Highest Rate in Nation“
By Dennis Norman, on January 16th, 2015 Missouri foreclosure filings during 2014 occurred on a total of 9.762 properties in Missouri which is down over 70% from 2010 when foreclosure activity in Missouri hit an all-time record high with foreclosure filings occurring that year on 33,120 properties, according to data just released by RealtyTrac. Below is a complete table showing Missouri foreclosure filings for each year, from the real estate “boom” year of 2006 through 2014, for all counties in Missouri which reveals that in most counties in Missouri foreclosure activity peaked during 2010.
Foreclosure filings in the Missouri counties that make up the St Louis MSA occurred on a total of 5,310 properties during 2014, down 68% from 2010 when foreclosure activity hit a record high in the Missouri counties of the St Louis MSA with foreclosure filings taking place on 16,588 properties that year.
(We work hard on this and sure would appreciate a “Like”)[iframe http://www.facebook.com/plugins/like.php?href=https%3A%2F%2Fwww.facebook.com%2FStLouisRealEstateNews&send=false&layout=standard&width=50&show_faces=false&font&colorscheme=light&action=like&height=35&appId=537283152977556 100 35 ]
Search St Louis Foreclosures For Sale
Continue reading “Missouri Foreclosure Filings For 2014 Down Seventy Percent From Peak in 2010“
By Dennis Norman, on January 10th, 2015 The bursting of the real estate market bubble back in 2008 led to opportunities for investors to buy up homes at attractive prices throughout the country and even attracted some large firms backed by Wall Street such as Blackstone, American Homes 4 Rent, Colony American Homes and Fundamental REO. While institutional ownership of commercial real estate, apartments and land has been very common, and in fact, predominant, since entering the business in 1979, firms like this investing in single family homes has not. The best I can tell, St Louis has not attracted any of the four largest institutional investors (although it is hard to tell because they could own property in LLC’s not easily identified to be them) however, there has been plenty of investor activity here, including some by institutional investors.
So, what is an “institutional investor”? Well, for the purposes of this article, and the data below, we’ll consider it to be an entity that buys at least 10 homes a year thereby separating them out from the small and/or occasional investor. One such investor that has been active in St Louis is BLT (Building Land & Technology out of Connecticut) which, at this time, appears to own around 700 single family homes in the St Louis area. However, as the table below shows, ownership of homes in St Louis by institutional investors is pretty minimal, with those types of investors having acquired over the past 3 years (the most active period for this type of investment) at total of just over 6,000 homes or, just over 1 percent of the total housing stock in the five-county core St Louis market.
(We work hard on this and sure would appreciate a “Like”)[iframe http://www.facebook.com/plugins/like.php?href=https%3A%2F%2Fwww.facebook.com%2FStLouisRealEstateNews&send=false&layout=standard&width=50&show_faces=false&font&colorscheme=light&action=like&height=35&appId=537283152977556 100 35 ]
Search St Louis Foreclosures For Sale
Continue reading “Institutional Investors Own Only About 1 Percent Of Homes In St Louis“
By Dennis Norman, on January 6th, 2015 As a result of the real estate market crash in 2008 and the subsequent downturn in the economy, many homeowners with prior stellar payment records on their mortgages ended up losing their homes in foreclosure or being forced to do a short sale to get out from under it. Most of these former homeowners then became renters but have the desire to buy a home again once back on their feet. However, depending upon just how severely their credit was impacted as well as whether they had a foreclosure, short sale or bankruptcy, they may have to wait as long as 7 years to obtain a home loan again. However, thanks to an FHA program called “Back to Work”, which, surprisingly, has received little attention, there is hope for these homeowners including the opportunity to obtain a home loan again without the normal waiting period if their problems were related to a job loss and they meet certain criteria.
The Back to Work program allows borrowers that may be otherwise ineligible for an FHA-insured mortgage due to FHA’s waiting period for bankruptcies, foreclosures, deeds-in-lieu, and short sales, as well as delinquencies and/or indications of derogatory credit, including collections and judgments, to be eligible for an FHA-insured mortgage if the borrower meets certain guidelines, which include:
(We work hard on this and sure would appreciate a “Like”)[iframe http://www.facebook.com/plugins/like.php?href=https%3A%2F%2Fwww.facebook.com%2FStLouisRealEstateNews&send=false&layout=standard&width=50&show_faces=false&font&colorscheme=light&action=like&height=35&appId=537283152977556 100 35 ]
Continue reading “Program To Help Short Sellers and Foreclosed Owners Buy Again“
By Dennis Norman, on December 31st, 2014 St Louis Distressed Home Sales ticked up slightly in November 2014 rom October but declined over thirty percent (30.8%) from November 2013, according to data just released by RealtyTrac. As the table below shows, all the counties in the St Louis core market except one saw an increase in distressed home sales in November from the month before and all saw a decline in November from a year ago.
On a national level, distressed home sales in November 2014 accounted for 12.6% of all home sales, down from 13.7% in October and from 14.8% in November 2013.
(We work hard on this and sure would appreciate a “Like”)[iframe http://www.facebook.com/plugins/like.php?href=https%3A%2F%2Fwww.facebook.com%2FStLouisRealEstateNews&send=false&layout=standard&width=50&show_faces=false&font&colorscheme=light&action=like&height=35&appId=537283152977556 100 35 ]
 Copyright 2014 – St Louis Real Estate News – Data Source: RealtyTrac
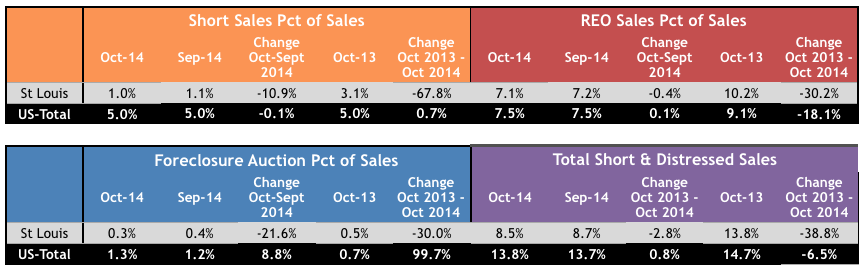
By Dennis Norman, on November 28th, 2014 St Louis Distressed Home Sales continue to have less impact on the St Louis real estate market paving the way for sustainable home appreciation, according to the latest data available from RealtyTrac. According to the chart below, short sales in St Louis accounted for just 1% of the overall home sales last month, a 10% decrease from the month before and a decrease of almost 68% from a year ago. Nationally, short sales accounted for 5% of all home sales last month.
St Louis REO’s (bank-owned properties obtained through foreclosure) declined slightly in October from the month before and dropped over 30% from a year ago.
(We work hard on this and sure would appreciate a “Like”)[iframe http://www.facebook.com/plugins/like.php?href=https%3A%2F%2Fwww.facebook.com%2FStLouisRealEstateNews&send=false&layout=standard&width=50&show_faces=false&font&colorscheme=light&action=like&height=35&appId=537283152977556 100 35 ]
By Dennis Norman, on November 25th, 2014 Today, the Federal Housing Finance Agency (FHFA) told Fannie May and Freddie Mac to change their policies to allow foreclosed homeowners the opportunity to buy their home back at the property’s fair-market value, just like any other purchaser can. Currently, if a foreclosed homeowner wanted to buy their home back from Fannie Mae or Freddie Mac they would be required to pay the entire amount owed on their previous mortgage although a non-related purchaser, not buying the home for the benefit of the former homeowner, only has to pay the current fair market value.
“This is a targeted, but important policy change that should help reduce property vacancies and stabilize home values and neighborhoods,” said FHFA Director Melvin L. Watt. “It expands the number of potential buyers of REO properties and is consistent with the Enterprises’ practice of requiring fair-market value for those properties.”
(We work hard on this and sure would appreciate a “Like”)[iframe http://www.facebook.com/plugins/like.php?href=https%3A%2F%2Fwww.facebook.com%2FStLouisRealEstateNews&send=false&layout=standard&width=50&show_faces=false&font&colorscheme=light&action=like&height=35&appId=537283152977556 100 35 ]
By Dennis Norman, on November 21st, 2014 Property “flips” in St Louis slowed during the 3rd quarter of this year to just 234 properties flipped in the St Louis MSA during the quarter making up 2.6% of overall home sales for the quarter, a decline of 20% from the quarter before and a decline of 55% from the third quarter of 2013, according to data just released by RealtyTrac. Property flipping is a term that has been loosely applied to a variety of real estate transactions but, for the purpose of this report, was considered to be when a single family home sold in during the third quarter had been sold within the previous 12 months.
Back in 1979, when I entered the real estate business, my focus was on buying property to resell and a “flip” at that time referred to a property I had under contract to buy that I managed to sell, or “flip” to someone else (often a competitor) with the closing of both my purchase and my sale taking place on the same day, hence a “flip”. So, in the last 35 years a flip has went from being a property bought and sold on the same day to one bought and sold within a year…hmm…
Find St Louis Property to Flip

(We work hard on this and sure would appreciate a “Like”)[iframe http://www.facebook.com/plugins/like.php?href=https%3A%2F%2Fwww.facebook.com%2FStLouisRealEstateNews&send=false&layout=standard&width=50&show_faces=false&font&colorscheme=light&action=like&height=35&appId=537283152977556 100 35 ]
By Dennis Norman, on November 14th, 2014 St Louis Foreclosure Activity was on the rise during the month of October with a big spike in foreclosure activity from the month before in St Charles and Franklin Counties as well as the St Louis MSA as a whole, according to newly released data from RealtyTrac. As the table below shows, St Charles County saw an increase of over 3,000% in foreclosure activity during the month of October from September, and over a 400% increase in activity from October 2013, however, this is the result of a large influx of REO property in October. When you look at the second table below, showing year-to-date foreclosure activity, you will see that St Charles County foreclosure activity is actually down 13.6% in 2014 from the same time period in 2013.
(We work hard on this and sure would appreciate a “Like”)[iframe http://www.facebook.com/plugins/like.php?href=https%3A%2F%2Fwww.facebook.com%2FStLouisRealEstateNews&send=false&layout=standard&width=50&show_faces=false&font&colorscheme=light&action=like&height=35&appId=537283152977556 100 35 ]
Search St Louis Foreclosures For Sale
Continue reading “St Louis Foreclosure Activity Increases In October But Down Overall“
By Dennis Norman, on November 13th, 2014 Yesterday, the Missouri Supreme Court handed down it’s decision in the case “Missouri Bankers Association, Inc., and Jonesburg State Bank v. St. Louis County, Missouri, and Charlie A. Dooley” ruling in favor of the Appellants (Missouri Bankers Association and Jonesburg State Bank) and against the Respondents (St Louis County and Charlie A. Dooley) by reversing an lower courts decision that ruled the Banker’s suit was moot. The original suit was filed after St Louis county enacted its “Mortgage Foreclosure Intervention Code” which, among other things, required mediation prior to a bank or other lender proceeding with a foreclosure on a deed a trust.
In it’s decision, the Missouri Supreme Court ruled that the ordinance passed by St Louis County known as the “Mortgage Foreclosure Intervention Code” was “void and unenforceable” because the county exceeded its charter authority when enacting the ordinance.
(We work hard on this and sure would appreciate a “Like”)[iframe http://www.facebook.com/plugins/like.php?href=https%3A%2F%2Fwww.facebook.com%2FStLouisRealEstateNews&send=false&layout=standard&width=50&show_faces=false&font&colorscheme=light&action=like&height=35&appId=537283152977556 100 35 ]
By Dennis Norman, on October 29th, 2014 Halloween may be just two days away however zombies are getting harder to find in St Louis, or at least “foreclosure zombies“. That’s right, according to the latest data from RealtyTrac, during the 3rd quarter of this year St Louis had 481 zombie foreclosures (homes in the foreclosure process, not yet foreclosed upon and the owner has vacated) or about 33 percent of the St Louis foreclosures. This is down 40 percent from the quarter before and down 70 percent from a year ago.
This is good news as zombie foreclosures quickly become a nuisance as well as an eyesore for the neighborhood as the owner has left and is no longer maintaining the property however, the lender has not yet foreclosed and therefore is typically not maintaining the property either. The zombie ends up kind of in “no man’s land” until the foreclosure is finally complete and the lender’s asset manager takes control.
(We work hard on this and sure would appreciate a “Like”)[iframe http://www.facebook.com/plugins/like.php?href=https%3A%2F%2Fwww.facebook.com%2FStLouisRealEstateNews&send=false&layout=standard&width=50&show_faces=false&font&colorscheme=light&action=like&height=35&appId=537283152977556 100 35 ]
Search St Louis Foreclosures For Sale Continue reading “Zombies Are Becoming Scarce In St Louis“
By Dennis Norman, on October 28th, 2014 Distressed home sales in St Louis accounted for 7.97 percent of all home sales during the 3rd quarter, down from 9.84 percent the quarter before and down a whopping 40 percent from a year ago when distressed sales accounted for 13.6 percent of all homes sold in the St Louis MSA, according to the latest data from RealtyTrac. State-wide for Missouri, distressed home sales made up 7.12 percent of home sales during 3rd quarter, lower than the rate for St Louis however, at the other side of our state, in Kansas City, distressed home sales share of home sales was 9.2% for 3rd quarter, about 15% higher than St Louis. The table below shows the breakdown of distressed sales by short sales, REO’s and foreclosure auction.
(We work hard on this and sure would appreciate a “Like”)[iframe http://www.facebook.com/plugins/like.php?href=https%3A%2F%2Fwww.facebook.com%2FStLouisRealEstateNews&send=false&layout=standard&width=50&show_faces=false&font&colorscheme=light&action=like&height=35&appId=537283152977556 100 35 ]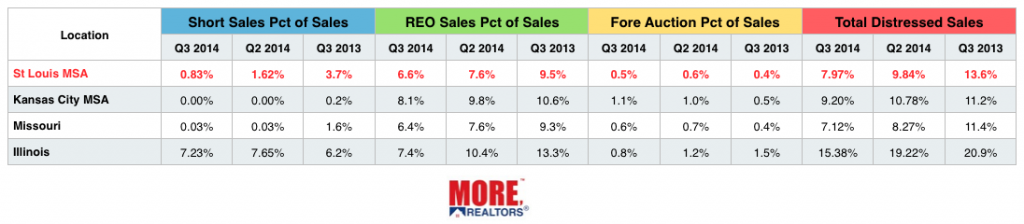
By Dennis Norman, on October 16th, 2014 Foreclosures in the St Louis area fell dramatically during the 3rd quarter of this year with 1,529 total foreclosure actions on property in the St Louis MSA, a decline of 28.05 percent from the prior quarter and a decline of 53.04 percent from the same quarter a year ago, according to the latest data from RealtyTrac. As our table below shows, during the 3rd quarter of this year all the counties in the core area of the St Louis market saw double digit declines in foreclosure activity from both the quarter before as well as the same period a year ago with the exception of Franklin County. Franklin County saw foreclosure activity increase over 300 percent from the quarter before and almost 50 percent (48%) from a year ago.
(We work hard on this and sure would appreciate a “Like”)[iframe http://www.facebook.com/plugins/like.php?href=https%3A%2F%2Fwww.facebook.com%2FStLouisRealEstateNews&send=false&layout=standard&width=50&show_faces=false&font&colorscheme=light&action=like&height=35&appId=537283152977556 100 35 ]
Search St Louis Foreclosures For Sale
Continue reading “St Louis Area Foreclosures Plummet In 3rd Quarter Except in Franklin County“
By Dennis Norman, on September 30th, 2014 The St Louis Foreclosure rate in July 2014 was 0.78 percent, down almost 30 percent from the same time last year when the St Louis foreclosure rate was 1.08 percent, according to data just released by Corelogic. The foreclosure rate for the state of Missouri in July 2014 was .64%, down from .89% a year ago.
On another good note, the serious mortgage delinquency rate (90+ days) for St Louis in July 2014 was 3.33%, down from 3.85% in July 2013. On the state level, the Missouri serious mortgage delinquency rate for July 2014 was 3.06% down from 3.52% the year before.
(We work hard on this and sure would appreciate a “Like”)[iframe http://www.facebook.com/plugins/like.php?href=https%3A%2F%2Fwww.facebook.com%2FStLouisRealEstateNews&send=false&layout=standard&width=50&show_faces=false&font&colorscheme=light&action=like&height=35&appId=537283152977556 100 35 ]
Search St Louis Foreclosures For Sale
Continue reading “St Louis Foreclosures & Serious Delinquencies Fall In Past Year“
By Dennis Norman, on September 11th, 2014 For the first time in a long time, there was an increase in St Louis Foreclosures with 497 foreclosure actions in August, equivalent to 1 foreclosure action for every 2,511 housing units, an increase of 2.47 percent from the month before. While up from the month before, St Louis Foreclosures in August 2014 were down 58.41% from August 2013. As the table below shows, St Charles County had a big decline in foreclosure activity in August and the city of St Louis a modest decline, but Jefferson County and Franklin County both saw increases in foreclosures over over 100% from the month before. With the exception of Franklin County, all the counties listed had a double digit decline in foreclosure activity from the year before.
(We work hard on this and sure would appreciate a “Like”)[iframe http://www.facebook.com/plugins/like.php?href=https%3A%2F%2Fwww.facebook.com%2FStLouisRealEstateNews&send=false&layout=standard&width=50&show_faces=false&font&colorscheme=light&action=like&height=35&appId=537283152977556 100 35 ]
Search St Louis Foreclosures For Sale
(see a slideshow of all foreclosures for sale below)
Continue reading “St Louis Foreclosures Rise Slightly In August; Up over 100 Percent In Outlying Areas“
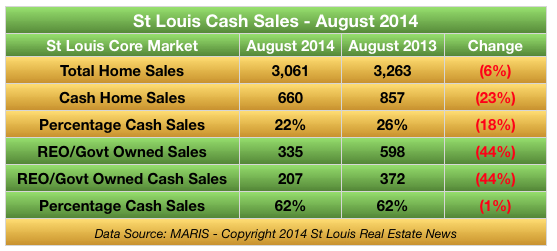
By Dennis Norman, on September 9th, 2014 The number of St Louis Foreclosures (bank and government owned) continues to decline resulting in just 335 St Louis Foreclosures being sold during the month of August 2014 in the St Louis Core market, a decline of 44% from August 2013 when there were 598 St Louis Foreclosures sold. What hasn’t changed though is the fact that nearly two-thirds (62%) of the foreclosures sold were cash sales for both periods. For the St Louis real estate market as a whole, cash sales made up for fewer of the home sales in August 2014 with just 22% of all homes being sold on a cash sale, down from 26% a year ago.
(We work hard on this and sure would appreciate a “Like”)[iframe http://www.facebook.com/plugins/like.php?href=https%3A%2F%2Fwww.facebook.com%2FStLouisRealEstateNews&send=false&layout=standard&width=50&show_faces=false&font&colorscheme=light&action=like&height=35&appId=537283152977556 100 35 ]
By Dennis Norman, on August 14th, 2014 St Louis foreclosure activity was on the decline again in July with a total of 485 foreclosure actions taking place in the St Louis MSA during the month which equates to foreclosure activity on 1 of every 2,573 housing units, according to data released this morning by RealtyTrac. This represents a decline in St Louis foreclosure activity of 19.57% from the month before and a decline of 59.0% from July 2013. As the table below shows, with the exception of Franklin County, all of the major Missouri counties of the St Louis MSA saw a decline in foreclosure activity from both the month before as well as a year ago.
(We work hard on this and sure would appreciate a “Like”)[iframe http://www.facebook.com/plugins/like.php?href=https%3A%2F%2Fwww.facebook.com%2FStLouisRealEstateNews&send=false&layout=standard&width=50&show_faces=false&font&colorscheme=light&action=like&height=35&appId=537283152977556 100 35 ]
Search St Louis Foreclosures For Sale
(see a slideshow of all foreclosures for sale below)
Continue reading “St Louis Foreclosure Activity Down Fifty-Nine Percent In Past Year“
By Dennis Norman, on July 24th, 2014 Even though, for a while now, foreclosures have been on the decline in St Louis as well as in most parts of the country, there are still many St Louis neighborhoods that are being impacted significantly by foreclosure activity. While after the housing bubble burst in 2008 we foreclosures appeared in most every neighborhood in St Louis from areas with the lowest values to areas with the highest, there has been a concentration of foreclosure activity in a few areas of St Louis. The city of Florissant, for one, is an area that has had more than it’s fair share of foreclosure activity and has seen pretty severe impact on home values there as a result.
Which St Louis Neighborhoods Have The Highest Foreclosure Rates?
As I mentioned previously, Florissant has been pounded with foreclosures, however, as the table below shows, there are many areas throughout the St Louis area, including areas in St Louis City as well as the counties of St Louis, St Charles, Jefferson and Franklin, that are on the list of the 19 highest foreclosure rate areas of St Louis. Below the table is an interactive foreclosure map for Missouri where you can find foreclosure rates for any county in Missouri or, click on the county and find foreclosure rates for any area within that county.
See ALL Foreclosures for sale in St Louis
[iframe http://www.facebook.com/plugins/like.php?href=https%3A%2F%2Fwww.facebook.com%2FStLouisRealEstateNews&send=false&layout=standard&width=50&show_faces=false&font&colorscheme=light&action=like&height=35&appId=537283152977556 100 35 ] Continue reading “Areas With Highest Foreclosure Rates In St Louis“
|
Recent Articles
|