By Dennis Norman, on September 20th, 2022 The short answer is yes. They decline every year as we head into winter due to the seasonal nature of the business. If you look at the first chart below which depicts the median price of homes sold in the St Louis 5-County core market since 1998, you will notice a very consistent pattern of prices rising in the spring and summer, then declining in the fall and winter. For the most part, the other pattern you will see is that the peak each spring is higher than the spring before and the bottom each winter is higher than the winter before, but there are exceptions to that such as after the bubble burst in 2008.
So, as we head into the fall season, we can expect home prices to decline. The question is, given all that is going on in the economy, including mortgage interest rates in excess of 6%, will the decline be more than the typical “seasonal adjustment”? To address this, the first thing we can look at is the percentage decline we’ve seen in the recent past from the summer peak to September which is as follows:
- 2019 – Summer peak to September –10.9%
- 2020 – Summer peak to September – 0% (no change)
- 2021 -Summer peak to September –1.9%
- 2022 -Summer peak to September –10.2%
What this reveals is this years decline, while definitely larger than the last two years, is actually less than the decline in 2019 (which was a good market) so this doesn’t jump out as particularly alarming. I think it’s worth saying that we are no doubt going to have a market “correction” or “adjustment” at a minimum because home prices could not simply keep increasing like they have been so this years seasonal adjustment may just be a return to normal. Having said that though, since the “bottom” of the winter market price-wise doesn’t usually come until January or February, we will need to watch the next couple of months to see if this downward price trend remains consistent with historic norms or in fact picks up steam and looks like it’s headed for a bigger decline than normal. My guess is at this point it the latter. While I’m not a “gloom and doomer” in fact, I like to think of my self as an opportunist and see opportunities in challenging markets, I just think I’m being realistic. There are a lot of moving balls in the air right now with regard to our economy and more unknowns than certainties in my opinion.
We can’t underestimate the impact of interest rates either…
Continue reading “Will St Louis Home Prices Decline?“
By Dennis Norman, on September 6th, 2022 The 12-month home sales trend in the St Louis 5-county core market declined in August to 27,840 homes sold in the 5-county area during the prior 12-months, marking the lowest 12-month sales number since September 2020. As the chart below illustrates, the 12-month home sales trend in St Louis has declined now for 11-months in a row landing just slightly higher than the 12-months sales of 27,573 for September 2020.
The St Louis home sales trend is still higher than any period after August 2006 and prior to September 2020…
At the current level, the St Louis home sales trend is slightly above the trends prior to September 2020 going back to the peak of the bubble in August 2006 when there were 27,974 homes sale in the prior 12-months. However, if it declines further will be in the range of the years 2016 through mid-2020.
St Louis Home Price Trend Outpacing Sales…
The chart below also shows the median price per foot for homes sold during the prior 12-month period. As it shows, the home price trend has continued to increase while the sales trend has been declining however that changed in June when the price trend started declining. If you look back t prior years you will see that is earlier than when the normal seasonal adjustment comes so it is likely indicative of the market.
Continue reading “St Louis Home Sales Trend Declines In August For the 11th Consecutive Month“
By Dennis Norman, on August 12th, 2022 We continue to see more price reductions on listings, or, as some agents prefer to refer to them as “price improvements”, throughout the St Louis area. As the infographic below depicts, as of today one-third of the active listings in the St Louis 5-County core market have a current asking price that is below their original price.
Continue reading “One-Third Of St Louis Homes Listed For Sale Have Reduced The Price“
By Dennis Norman, on July 8th, 2022 Price reductions are quickly showing up more and more on real estate listings in the St Louis area. As the Infograph below illustrates, 31% of the current active listings in St Louis have had at least one price reduction. Since the price homes sell at isn’t known until closing and a home sale typically takes 4 to 6 weeks to close, the actual sold prices won’t reflect these price reductions for a while. For example, in the past 30 days (through today) there have been 2,381 closings of home sales in the 5-county St Louis core market at a median price of 104% of the original list price. In about a month we’ll revisit that stat and see how things look.
Continue reading “Nearly One-Third Of St Louis Homes Listed For Sale Have Reduced The Price“
By Dennis Norman, on July 7th, 2022 Ever heard the expression “It’s not if, but when..”? That is something that I’ve heard for a while now about a recession. With everything that has happened to our economy including rising interest rates, rising inflation, the government printing more and more currency and running up greater debt, it seemed inevitable we would see a recession. To officially be in a recession, the GDP (Gross Domestic Product) has to fall for two successive quarters. For the first quarter of this year, GDP declined at an annual rate of 1.6%. The second quarter GDP numbers won’t be released until later this month (July 28th) however, the GDPNow forecasting model of the Federal Reserve Bank of Atlanta is forecasting a decline of 2.1% in GDP for the 2nd quarter of this year at this point. If their forecast is correct, we will officially be in a recession.
What happens to St Louis home prices during a recession?
There are many factors at play in every recession that make them unique, such as unemployment rates, interest rates, etc, making it unrealistic to think that home prices are going to behave the same way during every recession, however, I thought it would be worth looking at what happened during the last couple of recessions.
2020 Recession (Q1 and Q2)
We had a short recession in early 2020 caused primarily by COVID that only lasted the minimum period of two quarters. During this period, as the chart below shows, St Louis home prices continued to increase at a fairly consistent rate. In 2019 the median price of a home in the St Louis MSA was $188,575 and in 2020 it was $208,000, an increase of 10.3%. Then in 2021, the year after the recession, the median St Louis home prices was $227,000, an increase of 9.1% from the year before.
Continue reading “The Coming Recession and Its Potential Affect on St Louis Home Prices“
By Dennis Norman, on June 17th, 2022 Price reduction, what’s that? All we seem to have heard about the last couple of years with regard to home prices is how much OVER the list price buyers were having to pay in order to buy a home. So, to be talking about price reductions today seems odd. However, as the infographic below illustrates, there have been listings with price reductions over the past couple of years, it’s just the current level of them is higher than we have seen in a while.
Continue reading “Over One-Fourth of St Louis Homes For Sale Have Reduced Asking Prices“
By Dennis Norman, on June 15th, 2022 After over 40 years in the real estate business in St Louis I’ve seen many times just how fast a good, or even great housing market can turn sour as well as the other way around. Two years ago, economic conditions relevant to the housing market included:
Today, the above conditions are:
Does this mean St Louis home prices will come crashing down?
First off, I’m not an economist, in fact I didn’t even attend college and I certainly don’t have a crystal ball showing me the future, but I am a data junkie that has lived through a variety of markets spanning more than 4 decades. My experience as well as my study of past markets as well as current indicators of things to come certainly give me an opinion. In times past, my opinions on the market have been spot on, almost to the point that I even surprised myself (such as in October 2006, at the peak of the housing boom when I predicted the collapse) and other times I’ve been wrong, sometimes way wrong. The reality is that the housing market is affected, or can be affected by so many different economic factors, as well as social issues, consumer sentiment and more that I don’t believe anyone can predict what it’s going to do accurately consistently.
Continue reading “Will Home Prices Come Crashing Down?“
By Dennis Norman, on June 10th, 2022 With the bidding wars we’ve seen on listings resulting in sold prices that exceed the asking price in St Louis over the past couple of years, it’s hard to imagine that home values could be lower today than a year ago. Now, before you call me crazy, I’m not saying that St Louis homes are SELLING for LESS now than a year ago. As our STL Market Chart below shows, the median price of homes sold in the St Louis 5-county core market was $254,950 in May 2021 and $270,000 last month, for an increase in sales price of 5.9%. However, given that, as the chart at the bottom shows, the inflation rate has increased 8.6% during the past 12-months, St Louis home prices have not increased as much as inflation, thereby leaving them worth less today than they were worth a year ago after adjusting for inflation.
Home prices last month would have needed to be $276,829 to keep pace with inflation…
In order to keep pace with inflation and make a median-priced St Louis home worth the same in today’s dollars as it was worth a year ago it would have be worth $276,829 today at the current rate of inflation.
If we look farther back it gets better….
Continue reading “St Louis Home Values Declined In Past 12-Months After Inflation“
By Dennis Norman, on June 10th, 2022 There were 5,138 building permits issued for new single-family homes in the St Louis area during the 12-month period ended April 30, 2022, a decrease of 9.69% from the same period a year ago when there were 5,138 permits issued, according to the latest data from the Home Builders Association of St. Louis & Eastern Missouri (St Louis HBA). Four of the seven counties covered in the report saw a double-digit decrease in building permits from the same period a year ago.
St Louis New Home Building Permits -April 2022

By Dennis Norman, on May 9th, 2022 There have been a lot of reports over the past month about rising interest rates (mortgage rates on a 30-year fixed-rate mortgage hit 5.27% last week) as well as rising inflation rates (8.5% in March) and the effect these things will have on the housing market. It’s no doubt they will have some affect on home prices and sales and I have been watching the data on St Louis home prices and sales closely and so far there does not appear to be much impact.
St Louis home sales increase in April from March…
There are two ways we analyze home sales at MORE, REALTORS®; the traditional manner, which is what almost all public reports are based upon, closed sales (which are really indicative of what the market was like 1-2 months previously since that is when the contracts were typically written) and then by use of our STL Real Estate Trends Report, which gives us a better idea of the current activity. Our trends report shows the number of new contracts written on listings, so current sales activity as well as the number of new listings entering the market. The good news is, when looking at St Louis home sales activity for April, both closed sales and newly written contracts increased from the month before.
As our chart below shows, there were 2,134 homes sold in St Louis (5-county core market) during April, a 6.4% increase from March when there were 2,005 homes sold. As the STL Real Estate Trends Report shows, there were 3,279 new contracts written on homes during April in the St Louis 5-county core market, an increase of 5% from the prior month when there were 3,124 contracts written.
Continue reading “St Louis Home Sales Doing Well In Spite of Rising Interest Rates & Inflation“
By Dennis Norman, on April 15th, 2022 Yesterday, I wrote an article addressing the high rate of inflation just reported and its impact on the St Louis housing market. In it, I promised to take a deeper look into the effect of the current events related to the economy on St Louis home prices which I will do in this article.
Before I go further, I should mention I’m not an economist nor a fortune teller. I am, however, a real estate broker and data nerd that has spent over 40 years in the St Louis real estate industry. I try my best to use my knowledge and experience to anticipate changes in the market and use this to help our agents and clients use this information to their advantage.
History always repeats itself..
I find the above old adage to be pretty accurate when it comes to the real estate market. Therefore, in trying to get my head around what impact a high inflation rate may have on home prices, I started by going back to prior periods of high inflation rates.
The first chart below shows the rate of inflation, interest rates, and the St Louis home price index. I’ve made some notes on it to show prior inflationary periods and the effect on home prices. The first period, the early 80s was much worse than today as inflation was higher and interest rates were in the stratosphere hitting 18%. The more recent period around 2007-2009 was not as severe and therefore the impact on home prices was not as dramatic as the former either. As you can see on the far right side of the chart, home prices have increased in the past several months at a sharp rate with the change from a year ago being greater than the last inflationary period but not as great as the one from the early ’80s.
The next chart shows the relationship between home prices and rent. When home prices outpace rent, home prices decline, when rent outpaces home prices, prices rise. As the chart shows, these two lines have converged indicating a reasonable balance between home prices and rent.
During the period of 2007 – 2011 home prices fell over 17% during a four year period before finally bottoming out.
Today is different though…
Continue reading “How Much Will St Louis Home Prices Be Impacted By Inflation?“
By Dennis Norman, on April 8th, 2022 Some remodeling projects are done by homeowners that plan to stay in their homes for the foreseeable future and want to get the most enjoyment and functionality out of living there. These homeowners typically aren’t as concerned, if at all, with getting a monetary return on their investment as their return is the enjoyment of the improvements. However, other homeowners, particularly those that may only be in their homes a couple of years or so before their next move, tend to focus more on making sure the remodeling they do will bring them a return on their investment to make it worthwhile. Granted, the return may be less than the cost but, after factoring in the enjoyment from the improvement the improvement may be worth it.
What are the remodeling projects that bring the best returns?
 According to the National Association of REALTORS® 2022 Remodeling Impact Report, below is the cost recovery of the top interior and exterior remodeling projects: According to the National Association of REALTORS® 2022 Remodeling Impact Report, below is the cost recovery of the top interior and exterior remodeling projects:
- Interior
- Hardwood flooring refinish- Return on cost – 147%
- New wood flooring – Return on cost – 118%
- Insulation upgrade – Return on cost – 100%
- Exterior
- Roofing – Return on cost – 100%
- Garage door- Return on cost – 100%
See the complete report (you can download a copy as well) by clicking the photo or HERE.
By Dennis Norman, on January 12th, 2022 As the STL Market Report (available exclusively from MORE, REATLORS®) below illustrates, there were 30,197 homes sold in the St Louis 5-county core market during 2021, an increase of 3.86% from 2020 when there were 29,075 homes sold. The median sales price of homes sold in the St Louis 5-county core market was $250,000 during 2021, an increase of 9.17% from 2020 when the median price of homes sold in St Louis was $229,000. The 5-county core St Louis market is comprised of the city and county of St Louis, along with the counties of Jefferson, Franklin, and St Charles. The St Louis core market is responsible for over 7y0% of all homes sold in the 17-county St Louis MSA market.
Housing inventory remains low…
As the last row of the report shows, there is still just a 0.6 month supply of homes for sale in the St Louis 5-county core market and the median time on the market is 64 days.
Continue reading “St Louis Home Sales in 2021 Tops Year Before By Nearly 4 Percent – Prices Up Over 9 Percent“
By Dennis Norman, on December 11th, 2021 As you’ve probably heard by now, the most recent inflation news was not good. As the chart below illustrates, the Consumer Price Index (CPI) for all products in the U.S. (city average) for November 2021 was 303.4, an increase of 6.88% from a year ago when it was 284.1. This is the highest 12-month increase in inflation we have seen in over 39 years, since June 1982.
What effect will this record-setting increase in inflation have on home prices?
The second chart below depicts the percentage change in the inflation rate from a year ago (the blue line) as well as the percentage change in the St Louis home price index from a year ago (the red line). As you look at the chart and reference the marked-up one I have below it, you will see a pattern. Historically, when inflation rates increase significantly and consistently from a year ago, lower home prices follow. Will this happen this time as well? It’s hard to say right now as we still have an incredibly low supply of homes on the market, which tends to fuel higher prices, and we’ll need to see if the rise in inflation is sustained over the next few months. For the time being, I’ll make the prediction that in 2022 we will see, at a minimum, a flattening of home prices…so maybe not a decline, but a pause on the rate of increase. Time will tell.
[xyz-ips snippet=”Foreclosures-For-Sale-and-Homes-For-Sale”]
Continue reading “Inflation Has Largest One-Year Increase In Over 39 Years – Will Home Prices Suffer?“
By Dennis Norman, on December 8th, 2021 Even though you wouldn’t know it by today’s forecasted high in St Louis of 50 degrees, we are entering the winter housing market. Every year, year after year, the St Louis winter housing market reacts pretty much the same way with home prices dropping a little and sales slowing followed by an uptick in both come spring. With that in mind, the declines we see in home prices in the chart and report below, available exclusively from MORE, REALTORS®, could be attributed to the seasonal change but are a little early for that, and different than last year.
Sold home price per square foot declined for 2nd month in a row in November…
The price per foot a home sells for is a relatively accurate indicator of rising home prices and typically will decline in the winter months as I mentioned above. However, if you look at the chart below, you will see the red line, which depicts the sold price per square foot of homes sold in the St Louis area, peaked in June at $172/foot, then dropped in July to $171/foot where it stayed though September before dropping to $165 in October and then remaining there in November. The result was a 4.0% decline in the price per foot of homes sold in St Louis from the peak in June to October.
If you look at the same period last year, you will see the price per foot peaked in July at $152 than stayed at $152 until dropping to $151 in October, then up to $153 in November and back to $152 in December. So, least year, the change from the peak to November was actually a slight increase compared with this year’s decrease of 4.%.
I’m not saying last years price behavior was the norm, I’m just pointing out that this years price activity is different than last year so it may be indicative of a change in the market.
Current listing prices reflect slower price appreciation…
Below the chart is the STL Market Report for November which shows home sales in the St Louis 5-county core market were up nearly 6% for the 12-month period ended November 30th from a. year ago and prices were up over 10% during the same period. However, if you look down to the second row of the report, you will see the price per foot homes sold at during the most recent 12-month period were sold at a price of $164.70 per foot (and in November as well) and the price per foot of homes currently listed is $168, so an increase of about 2% from the median price in the past 12-months. Granted, many of the current listings will likely sell for more than asking price, but this trend still indicates St Louis home price appreciation is slowing.
Continue reading “St Louis Home Price Appreciation Slowing“
By Dennis Norman, on November 17th, 2021 Last week I published an infographic in an article illustrating that 65% of the homes sold in St Louis sold at or above the list price. As the infographic below shows, this is a significantly higher percentage than was experienced in the midwest region as a whole where 55% of the homes sold at or above full price. 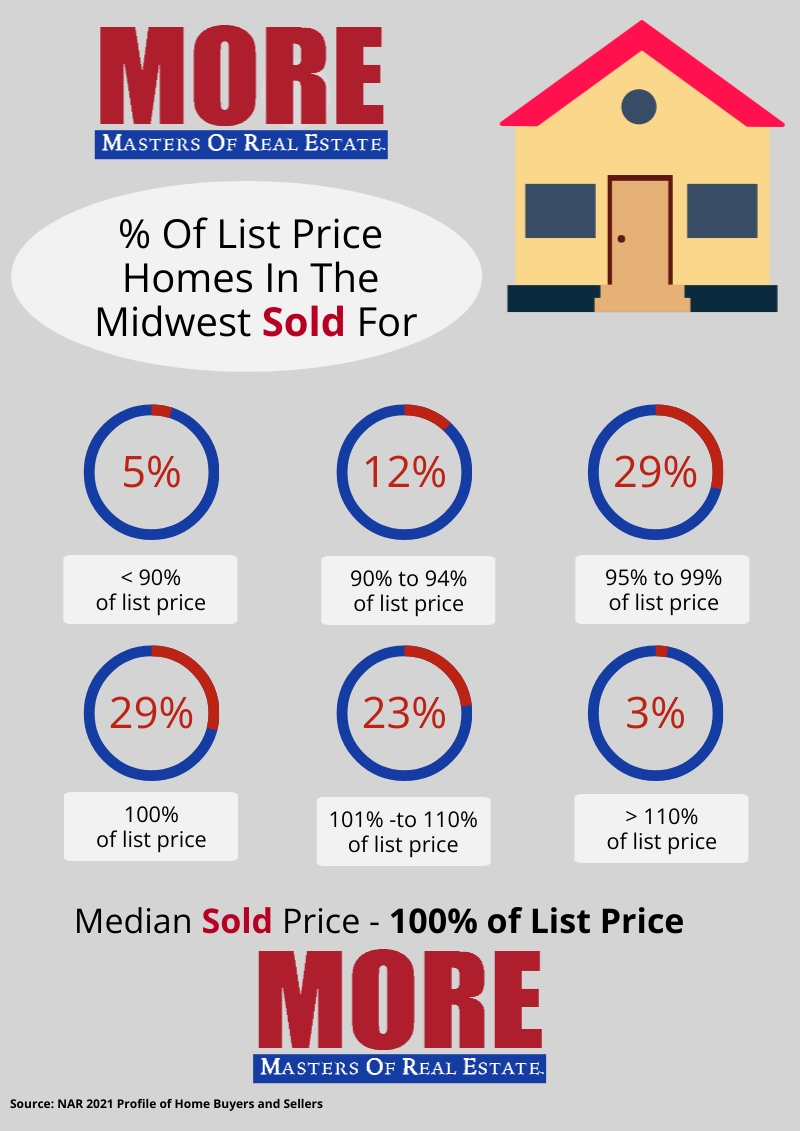
By Dennis Norman, on November 13th, 2021 Anyone paying even a little attention to the St Louis real estate market will likely be aware of the fact that we have been in a strong seller’s market for the past couple of years and St Louis home prices, as a result, have increased significantly. In fact, as the infographic below shows (exclusively available from MORE, REALTORS®) the median home price for a St Louis home has increased more than 50% in the past 14 years. However, the good news is that during that same period mortgage interest rates have fallen and remained low resulting an increase in the house payment on a typical home increase just over 5% during the same period!
[xyz-ips snippet=”Homes-For-Sale-and-Listings-With-Virtual-Tours”]

By Dennis Norman, on November 12th, 2021 Yesterday, I shared data showing that two-thirds of the homes sold in the St Louis 5-County core market (St Louis city and the counties of St Louis, St Charles, Jefferson, and Franklin) during October sold for the asking price or above. Today, I wanted to focus on just the luxury home market to see how that compared with the overall market. I included homes that sold for $750,000 or higher in this analysis.
As the infographic below shows (exclusively available from MORE, REALTORS®) there were 107 luxury homes sold (3.7% of all homes sold) during October in the St Louis 5-County core market with 41% of them selling at the list price or above. Drilling down further, we see that 28% of the St Louis Luxury homes sold for greater than the list price.
[xyz-ips snippet=”Homes-For-Sale-and-Listings-With-Virtual-Tours”]

By Dennis Norman, on November 11th, 2021 Two-thirds of the homes sold in the St Louis 5-County core market (St Louis city and the counties of St Louis, St Charles, Jefferson, and Franklin) during October sold for the asking price or above. As the infographic below shows (exclusively available from MORE, REALTORS®) there were 2,888 homes sold during October in the St Louis 5-County core market with 65% of them selling at the list price or above. One thing to remember about home prices though, and something you won’t hear from too many people reporting prices, is that not all sold prices are the “real” price.
[xyz-ips snippet=”Homes-For-Sale-and-Listings-With-Virtual-Tours”]
Continue reading “Two-Thirds Of Homes Sold In St Louis Core Market In October Sold At Or Above List Price“
By Dennis Norman, on October 31st, 2021 For the past few years now, we’ve experienced quite the seller’s market in St Louis fueled, in part, by a low supply of homes for sale. As a result, St Louis home prices have increased over the past few years at rates close to double the historic norm. Of late, we’ve heard a lot from people within, and outside of, the real estate industry expressing concern that home prices have gotten too high and even some have made comparisons to 2008 when the housing market saw the bubble burst. Being the data nerd I am, I’ve tried to keep emotion out of it and instead turn to the data to see if there were indications that perhaps St Louis home prices have increased too much and we are in for a correction. Up until now, the data has led me to believe that St Louis home prices were ok and can be sustained. However, based upon current data, I have a little different opinion as I write this.
So what has changed in the data to indicate home prices are too high?
For starters, I haven’t said St Louis home prices are too high yet, I’ve just said that the current data has changed my opinion. Having said that, prices may in fact reached levels that cannot be sustained and may need a downward correction to put them back in line or they may have just peaked and will remain rather flat for a period of time to allow the market to “catch up” with the prices. And, of course, data over the next month or two could change for the positive and show we’re not there yet and home prices can still go higher without a problem. For now, I’m going to say that, based upon the data as well as the normal seasonal adjustments we see this time of year, I’m going to expect to see St Louis home prices to decline somewhat during the winter months like normal, but then perhaps remain relatively flat come spring rather than increase in the spring like normal.
My opinion is based upon several pieces of data that, collectively, are indicating a coming adjustment in home prices to me. I have the charts below that illustrate this point and here’s my recap on them:
Continue reading “Have St Louis Home Prices Finally Increased Too Much?“
By Dennis Norman, on October 18th, 2021 I’ve written a couple of articles lately addressing the news reports about the housing market cooling down. As I’ve addressed in those articles, there has not really been much data supporting a significant cooling in the St Louis real estate market. Additionally, I’ve noted that, due to the seasonality of the housing market, and the fact we are headed toward winter, a cooling of the market would be the seasonal norm.
So today, I decided to pick an easier question to answer, “has the St Louis real estate market peaked?” The short answer is yes, I believe it has. This statement, by itself, is not all bad as it would NOT be good for St Louis home prices to continue to increase at the rates they have over the past couple of years. Not to mention, if we stay in this low-inventory market strongly favoring sellers much longer, many buyers are going to just give up and shelf the idea of buying for a while.
As usual, I’ll let the data speak for itself. I have several charts and tables below (available exclusively from MORE, REALTORS®) that I believe support that we have probably seen the St Louis market peak.
Continue reading “Has the St Louis Real Estate Market Peaked?“
By Dennis Norman, on October 13th, 2021 The St Louis housing market appears to be cooling off slightly with fewer home sales last month than a year ago in 3 of the 5 St Louis area counties that make up the St Louis 5-county core real estate market. As the charts below illustrate, the decline in the overall St Louis market was very slight, with 3,164 homes sold last month just 11 sales fewer than September last year when there were 3,715 homes sold in the St Louis5-county core market. The charts have complete details but below is a recap of home sales and prices by county for last month versus September 2020:
- St Louis City & County – These two counties combined are the only in the core market to see an increase in sales last month from a year ago. Last month there were 1,710 homes sold, an increase of 4.6% from a year ago when there were 1,634 homes sold. Last month the median price of homes sold was $247,000 and increase of nearly 7.5% from last year when it was $229,900.
- Franklin County – Last month there were 127 homes sold, a decrease of 13.6% from a year ago when there were 147 homes sold. Last month the median price of homes sold was $227,050 and increase of nearly 14.5% from last year when it was $198,300.
- Jefferson County – Last month there were345 homes sold, a decrease of 6.8% from a year ago when there were 370 homes sold. Last month the median price of homes sold was $229,000 and increase of nearly 9.0% from last year when it was $210,000.
- St Charles County – Last month there were 617 homes sold, a decrease of 10.8% from a year ago when there were 684 homes sold. Last month the median price of homes sold was $303,000 and increase of nearly 12.2% from last year when it was $270,000.
[xyz-ips snippet=”Homes-For-Sale”]
Continue reading “St Louis Area Housing Market Report For September“
By Dennis Norman, on September 24th, 2021 More and more today I’m seeing reports in the media about the housing market cooling down and sales slowing which, quite frankly, I have expected and keep watching for signs of it in the St Louis real estate market. However, in spite of a few blips on the radar, all the data I’m reviewing still shows pretty steady and consistent home sales in St Louis. Don’t get me wrong, I fully expect us to see a cooling of the St Louis market if for no other reason, winter will be here soon and then we’ll be headed toward year-end when the market always cools down. There are many factors that could come into play to further impact the market such as higher interest rates, a weaker economy as well as an influx of foreclosed homes hitting the market in the month ahead. For all of this, we will have to wait and see, but for now, things are pretty steady. Below are some charts and data that I feel support my thoughts on the market.
St Louis 5-County Core Market – Home Sales Trend
(click on chart for live, interactive chart)

As the chart above illustrates, the time it takes for a home to sell (days on market, represented by the brown line at the bottom) has been consistent the last four months, ranging from a low of 6 days to a high of 8 days. The green line shows the 12-month home sales trend and it has been fairly consistent the last 4 months as well, actually increasing in June, then dipping slightly in July only to rise again in August to nearly June’s level. Finally, the red line shows the median price per foot of the homes sold and that has also been consistent the last 4 months with a slight increase from $167/foot in May to $170 in June and then $171 in July and August.
St Louis Real Estate Trends Report
New Listings & New Sales (click on report for live report)
 
The above reports show that in the most recent week new contracts written for the sale of homes increased 29% from the week before and new listings increased 3% from the week before. During the week there were just about the same number of new listings as new sales at 764 and 767 respectively.
St Louis Area Supply of Listing Inventory
(click on report for live report)

The report above shows there is currently a 0.89 month supply of homes for sale in the St Louis 5-County market. This is only slightly higher than it has been in past months. Of the 5-counties in the core market, St Charles County has the lowest inventory of homes for sale with an inventory of just over half a month.
By Dennis Norman, on August 10th, 2021 In June of this year the Median price of homes sold in the St Louis 5-County core market was $266,000, 6.4% higher than the median list price of $250,000 for those homes sold. This breaks the record of 4.4% set in April and is the highest gap we’ve seen between the median sold price and listing price since we’ve been tracking it, In July the gap narrowed though, albeit slightly, with the median price of homes sold coming in at $265,000, 6.0% higher than the median list price of $250,000. Worth noting as well is between June and July, the median list price of homes in the St Louis 5-County core market stayed the same and the median sold price decreased 0.3%..
St Louis 5-County Core – Sold Price to List Price – July 2020 – July 2021 Chart
(Click on Chart for Live Chart with current data)

By Dennis Norman, on July 13th, 2021 What an interesting real estate market we’ve experienced in St Louis over the past few years! Seller’s fully expect their homes to sell the first weekend after hitting the market, with a feeding frenzy by buyer’s and bidding wars that drive the price above the list price. Buyer’s come to realize if they are going to be successful in buying a home they have to think fast, take chances and move quick! Heck, with a market like this, it’s no wonder a lot of folks, particularly sellers, don’t necessarily see a need for a real estate agent.
However, the reality is that sellers and buyers need a great agent now more than ever. Yes, I emphasized great as, like in any profession, there are varying levels of knowledge, experience and professionalism among real estate agents. In addition to having a great agent that agent needs timely, accurate market data, along with an understanding of the market resulting in complete market knowledge. Unfortunately, this combination is not easy to find.
So what’s the actual price, $270,000 or $250,000?
[xyz-ips snippet=”Homes-For-Sale”]
Continue reading “The Value of Good Data Coupled With a Good Agent“
By Dennis Norman, on July 1st, 2021 As the chart below illustrates (available exclusively from MORE, REALTORS®), homes in St Charles County sold for a median price equal to nearly 105% of the current list price of the listing in June, which is the highest percentage of list price for the counties that make up the St Louis 5-county core market. For the 9 months up to and including January of this year, 4 of the 5 counties all had a median sold price equal to 100% of the current list price with Franklin County averaging less. In January St Charles county took off followed by Jefferson County, St Louis County and St Louis City all of which saw the median sold price exceed 100% of the current list price. Franklin County made it up to 100% but has stayed there.
[xyz-ips snippet=”Homes-For-Sale-and-Listings-With-Virtual-Tours”]
St Louis Area Counties $ Of Current List Price Homes Sold For During Past 13 Months
(click on chart for live, interactive chart)

By Dennis Norman, on June 24th, 2021 In April of this year the Median price of homes sold in the St Louis 5-County core market was $250,000, 4.4% higher than the median list price of $239,450 for those homes sold. This is the highest gap we’ve seen between the median sold price and listing price since we’ve been tracking it. Last month the gap narrowed though with the median price of homes sold in May coming in at $258,000, 3.2% higher than the median list price of $249,900. Worth noting as well is between April and May, the median list price of homes in the St Louis 5-County core market increased 4.4% and the median sold price increased 3.2%.
St Louis 5-County Core Sold Price to List Price Chart
(click on chart for live chart)
[xyz-ips snippet=”Homes-For-Sale-and-Listings-With-Virtual-Tours”]
By Dennis Norman, on June 18th, 2021 For the 12-month period ended May 31, 2021, there were 30,225 homes sold within the St Louis 5-County core market, an increase in home sales of 13.91% from the prior 12-month period, according to the STL Market Report below, available exclusively from MORE, REALTORS®. During the same period, St Louis home prices increased 11.5% from a median of $213,000 to $237,500. As the report also shows, the current supply of listings for sale is low at 0.86 months.
[xyz-ips snippet=”Homes-For-Sale”]
STL Market Report For the St Louis 5-County Core Market
(click on report for live, complete report)

By Dennis Norman, on June 14th, 2021 
[xyz-ips snippet=”Homes-For-Sale”]
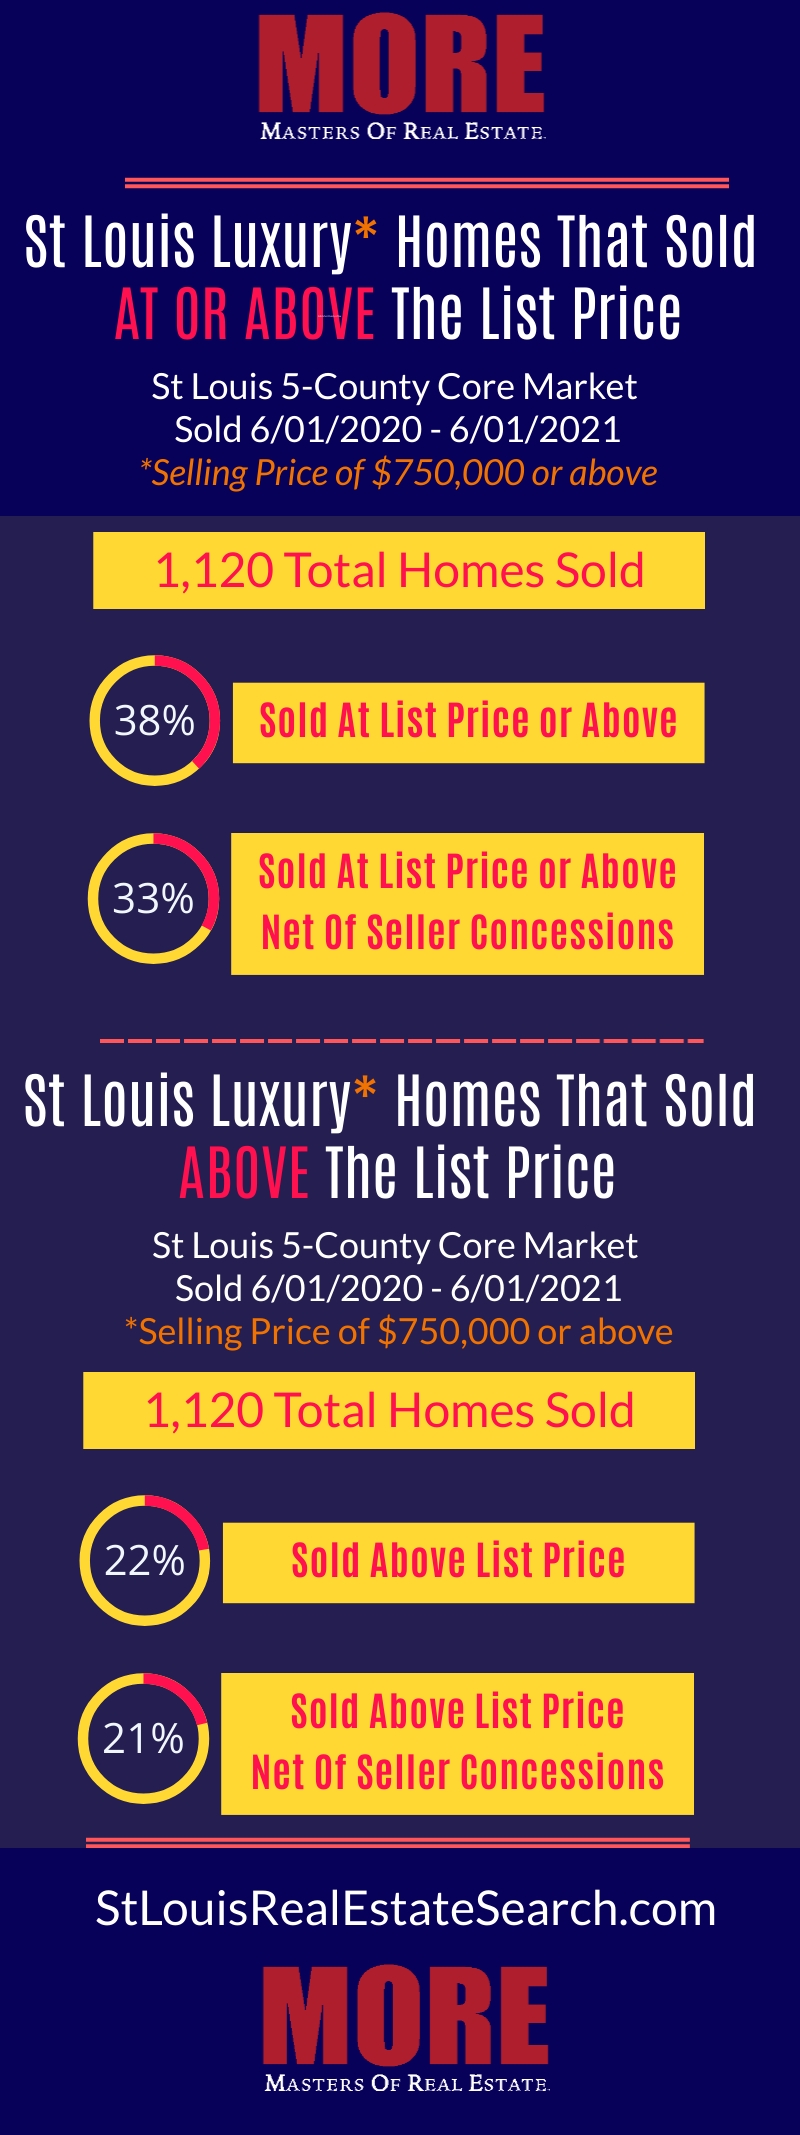
By Dennis Norman, on June 8th, 2021 Last week I shared data showing that nearly two-thirds of the homes sold in the St Louis 5-County core market (St Louis city and the counties of St Louis, St Charles, Jefferson and Franklin) during the past 12 months sold for the asking price or above. Today, I wanted to focus on just the luxury home market to see how that compared with the overall market. I included homes that sold for $750,000 or higher in this analysis.
As the infographic below shows (exclusively available from MORE, REALTORS®) there were 1,120 luxury homes sold (about 3% of all homes sold) during the past 12-months in the St Louis 5-County core market with 38% of them selling at the list price or above. Drilling down further, we see that 22% of the St Louis Luxury homes sold for greater than the list price.
[xyz-ips snippet=”Homes-For-Sale-and-Listings-With-Virtual-Tours”]
|
Recent Articles
|

