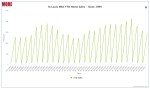
The St. Louis metropolitan area, encompassing counties in both Missouri and Illinois, has experienced a shift in its real estate market dynamics as of April 2025. This year, the region recorded a total of 7,926 homes sold, marking an 8.59% decrease compared to the 8,671 homes sold during the same period in the previous year. This change reflects various factors influencing the local market, providing potential home buyers and sellers with critical insights into current trends.
Despite the year-over-year dip, the St. Louis real estate market continues to offer diverse opportunities for both buyers and sellers. For those interested in areas with particularly fast-moving properties, MORE, REALTORS® has compiled a complete list of the fastest selling zip codes, available at the conclusion of this article. This information can be invaluable for making informed decisions in a market that, while experiencing a slight slowdown, still presents significant activity and potential for investment.
The St. Louis metropolitan area, spanning counties in both Missouri and Illinois, has experienced a slight shift in its real estate market this year. Through the end of March 2025, the region recorded 6,018 homes sold, marking a 6.25% decrease compared to the 6,419 homes sold during the same period in the previous year. This change reflects the dynamic nature of the local real estate market, which can fluctuate due to a variety of economic and environmental factors.
Despite the recent dip, the St. Louis real estate market continues to offer substantial opportunities for both buyers and sellers. Those interested in the fastest selling zip codes and more detailed market insights can find a complete list provided by MORE, REALTORS® at the end of this article. The current figures suggest a competitive market environment, where timely and informed decisions are crucial. Whether you are looking to buy a new home or sell your property, staying updated with the latest market trends is essential for navigating the real estate landscape effectively.
St. Louis, take a look at our live, interactive chart for January YTD home sales—a snapshot that tells quite a story. Here’s a breakdown of what the numbers are saying and why they matter to you.
A Look at the Data
January 2025:
YTD home sales came in at 1,674.
That’s an 8% drop from January 2024’s 1,820 sales.
Recent Year-Over-Year Shifts:
2020 to 2021: Sales surged from 2,060 to 2,539—a jump of roughly 23%.
2021 to 2022: A cooling set in with a decline of about 7.7% (from 2,539 down to 2,343).
2022 to 2023: We saw a dramatic plunge of around 27%, dropping from 2,343 to 1,707.
2023 to 2024: A modest rebound of roughly 6.6% brought us to 1,820, only for 2025 to dip again by about 8%.
Historical Averages Tell the Tale
Long-Term Average (1999–2025):
Over 27 years, January YTD sales have averaged about 1,755 homes.
Early years like 1999 and 2001 saw numbers in the 1,100–1,200 range, reflecting a very different market.
Past 10 Years (2016–2025):
The average here is a much higher 2,015 homes per January.
This recent decade witnessed a significant upswing, particularly with the 2021 spike.
Past 5 Years (2021–2025):
Averaging roughly 2,017 homes, these years remind us how exceptional 2021 was before the subsequent correction began in 2022.
What Does This Mean for You?
For Buyers:
The cooling trend after a record-setting 2021 means less frantic competition. More negotiating power could translate into better deals.
For Sellers:
The volatility signals a need to recalibrate expectations. Pricing strategies should reflect a market that’s shifted from its pandemic highs to a more balanced pace.
Overall Outlook:
The data suggests a market in transition. While the past decade raised the bar with double-digit figures, the recent downturns—especially the steep 27% drop in 2023—highlight that we might be entering a phase of adjustment. The fluctuations underscore the importance of staying informed and agile.
At MORE, REALTORS®
, our commitment is to provide transparent, client-focused insights that help you navigate these market shifts. Whether you’re buying or selling in St. Louis, understanding these trends can give you a competitive edge in making the best decisions for your future.
For a deeper dive, check out the live, interactive chart below. If you have questions or need tailored advice, reach out anytime—we’re here to help you turn data into strategy.
As of November 2024, year-to-date (YTD) home sales in the St. Louis metro area reached 28,672, marking a slight decline compared to the 29,072 homes sold by this time last year. This represents a reduction of 400 homes sold year-over-year, a modest dip of approximately 1.37%.
While this year’s figures are down slightly, the broader picture of the St. Louis housing market remains resilient, even amidst shifting economic and market conditions. To put this in perspective, the YTD home sales in November 2024 are still significantly higher than in some prior years, particularly during market troughs like 2010.
For home buyers and sellers, this data highlights the importance of staying informed about current market trends. Explore live, interactive charts “below” to dive deeper into the history of St. Louis real estate sales.
As of August 2024, year-to-date (YTD) home sales in St. Louis have reached 20,885, marking the lowest YTD level since August 2012, when sales were at 19,181. This represents a significant decline compared to more recent years, reflecting a slowdown in the real estate market. Various factors, including rising interest rates and affordability challenges, have contributed to this dip, and it’s clear that buyers are feeling the pressure.
This decline is even more striking when compared to the peak years, such as 2021, where YTD sales in August reached over 27,900. This downward trend indicates that we may be entering a new phase in the market where inventory challenges and buyer hesitancy could continue to play a significant role. Stay tuned here on St Louis Real Estate News to keep an eye on these trends, as they signal further shifts in the months ahead.
At MORE, REALTORS®, we give our agents an edge with proprietary software and access to over two decades of St. Louis housing data. This combination allows our team to truly know the market better than others and apply that knowledge to benefit buyers, sellers, and investors. Whether you’re looking for your next home or your next great investment, were here to guide you every step of the way.
St Louis MSA YTD Home Sales – Past 15 Years (Chart)
?agent_id=02107As of the end of July 2024, the St. Louis metro area has recorded 17,801 homes sold. This marks a slight increase from the same period last year, which saw 17,683 homes sold. Despite this year-over-year growth, the current sales figure represents a 7.6% decline from the median year-to-date home sales of 19,267 homes recorded between 1999 and 2020. Furthermore, when compared to the average year-to-date home sales of 18,855 homes from 1999 through 2024, this year’s performance is still trailing by approximately 5.6%. These statistics underscore a complex landscape for the St. Louis real estate market, balancing modest recent gains against broader historical trends.
For a detailed, live, and interactive chart showcasing YTD home sales for the St. Louis MSA from 1999 to present, be sure to check out the exclusive resource available from MORE, REALTORS®. This dynamic tool provides invaluable insights and allows users to explore the data comprehensively.
The St. Louis metropolitan area, which covers counties in both Missouri and Illinois, has seen a steady increase in home sales so far this year. According to data from MORE, REALTORS®, there have been 12,130 homes sold in the St. Louis metro area through the end of May 2024. This represents a 5.63% increase from the same period last year, when 11,483 homes were sold.
Compared to four years ago, when there were 13,295 homes sold through May 2024, this year’s sales have seen a slight decrease of 8.76%. However, this decrease is still within a reasonable range and does not indicate a significant decline in the market. Potential home buyers and sellers in the St. Louis metro area can take comfort in the fact that the market has remained stable over the years. For a complete list of the fastest selling zip codes in the area, be sure to check out MORE, REALTORS®. With this promising data, now may be the perfect time to make a move in the St. Louis metro area.
The St. Louis metropolitan area, which covers counties in both Missouri and Illinois, has seen a strong start to the year in terms of home sales. According to data from MORE, REALTORS®, there have been 9,035 homes sold in the St. Louis metro area through the end of April 2024. This represents a 5.54% increase from the same period last year, where 8,561 homes were sold.
While this year’s YTD home sales may be lower compared to four years ago, with a decrease of 11.78%, it is important to note that the overall trend is still positive. This is great news for both potential home buyers and sellers in the St. Louis metro area, as it indicates a stable and growing real estate market. For those looking to buy or sell a home, it is worth considering the fastest selling zip codes in the area, which can be found in the complete list provided by MORE, REALTORS®. So if you’re thinking about making a move in the St. Louis metro area, now is a great time to do so.
As of April 2024, the St. Louis metro area real estate market continues to show steady growth. According to data from MORE, REALTORS®, the median sold price for homes in the St. Louis area was $260,000, representing a 2.36% increase from April 2023 when the median sold price was $254,000. This also marks a 4.00% increase from the previous month, March 2024, when the median sold price was $250,000.
The median list price for homes in St. Louis was $250,000, a slight 0.04% increase from April 2023. This indicates that sellers are still able to command a strong price for their homes in the current market.
In terms of sales, there were 2,634 home sales in the St. Louis metro area in April 2024, a 9.70% increase from April 2023. This shows a continued high demand for homes in the area.
For those looking to buy or sell a home in the St. Louis metro area, now is a great time to take advantage of the strong market conditions. With the help of a knowledgeable and experienced REALTOR from MORE, REALTORS®, buyers and sellers can navigate this competitive market with confidence. Stay tuned for more updates on the St. Louis real estate market.
The 12-month home sales trend chart below from MORE, REALTORS® shows a slight upward tick in St. Louis home sales. In April, 32,210 homes were sold during the 12-month period ending in April, marking the highest home sales trend in St. Louis since August 2023. Granted, this is spring—a typically strong selling season for real estate. However, the 12-month sales ending in April 2024 are below the figures from a year ago, which stood at 34,490. Nonetheless, this uptick is a positive sign. It’s also noteworthy that this April marks the first time in three years that the trend has increased from March to April; in both 2022 and 2023, the trend declined during these months.
The St. Louis Metropolitan real estate market has experienced notable shifts in its latest 12-month cycle ending April 2024, as compared to the previous year. Firstly, the total number of homes sold in the St. Louis Metro area has seen a decline. Over the past 12 months, ending April 2024, St Louis home sales totaled 32,220 homes, a decrease of 6.58% from the previous year’s 34,490 homes. This reduction in sales volume may reflect a variety of market factors including economic shifts or changes in buyer sentiment.
Conversely, the median sold price for homes has edged upwards, indicating a resilient market valuation. The median sold price for homes in St Louis rose by 1.92% from $249,900 in the prior year to $254,700 in the period ending April 2024. This growth suggests a sustained buyer interest in value, despite the lower sales volume.
Inventory dynamics also present an intriguing picture. The number of listings sold last month was 2,612, with current listings standing at 2,840, and a supply of just over one month (1.09 months). These figures, coupled with a median of 22 days on market, highlight a competitive and swift market environment, challenging both buyers and sellers to act efficiently.
The STL Market Report below, available exclusively from MORE, REALTORS®, has more details on the above information as well as additional useful St Louis market data as well. For prospective buyers, sellers, and investors, understanding these market dynamics is crucial. The expertise of MORE, REALTORS® can provide the necessary guidance and strategic advice to effectively navigate this evolving market landscape.
The St. Louis 5-County Core market, encompassing St. Louis City County, St. Louis County, St. Charles County, Franklin County, and Jefferson County, reported a total of 4,518 home sales Year-to-Date through March 2024. This reflects a 4% increase in St. Louis home sales for the same period last year, which had 4,340 home sales. However, as the chart below—available exclusively from MORE, REALTORS®—shows, this represents varied performance compared to earlier years. In March 2022, there were 5,218 sales, a notable peak compared to 5,803 in 2021 and 5,216 in 2020.
This data highlights the fluctuations in the real estate market and is essential for understanding the current trends affecting both buyers and sellers in the region. For those navigating the complexities of real estate transactions, MORE, REALTORS® offers experienced guidance and in-depth market analysis
St Louis 5-County Core Market YTD Home Sales – 2020-2024
The St. Louis metro area’s real estate market has demonstrated significant fluctuations in home sales over the past fifteen years, revealing interesting trends for both homebuyers and sellers. Analysis of the 12-month home sales data chart, exclusively available from MORE, REALTORS®, illustrates a series of peaks and troughs that correspond closely with various economic factors impacting the region. St Louis home sales fell to the lowest point during the 15-year period in June 2011 when the 12-month period had 23,194 sales. Since hitting that low home sales have steadily increased until the 12-month trend hit 43,689 sales for the period ended September 2021. Since hitting that high, the sales trend has steadily decreased, while interest rates have increased at the same time, and appears to have stabilized around the 32,000 homes mark or at least has stayed at the level for the past 8 months. The median price of homes sold during the same period went from $97 per foot when sales hit their low in June 2011 to $170 per foot in March 2024 reflecting an annual rate of increase of 6.43%.
12-Month Home Sales and Price Trend – Past 15 Years
As of 2023, according to data from the Missouri Department of Elementary and Secondary Education and the Illinois State Board of Education, there are roughly 135-145 school districts within the 17 counties of the St. Louis Metropolitan Statistical Area (MSA). This figure includes public school districts but excludes private and charter schools. These districts vary significantly in size, home prices, and demand for homes. While strong school districts and top-rated schools are major attractions for home buyers and may reflect in the prices homes fetch compared to those in lesser districts, they do not guarantee quick sales. However, it is logical to assume that the quality of schools can significantly influence demand in various subdivisions.
What are the fastest-selling school districts in the St. Louis metro area currently?
As of today, the list below, available exclusively from MORE, REALTORS®, indicates that the Windsor C-1 School District in Jefferson County is the fastest-selling, with homes staying on the market for an average of just 5 days. It is followed by Smithton DIST 130 in Illinois, with an average of 6 days on the market, and Sunrise R-IX in Jefferson County, taking third place with 7 days. St. Clair County in Illinois claims five of the top ten spots for the fastest-selling school districts, followed by Jefferson County with three. It should be noted that smaller school districts, with fewer homes on the market, may have an advantage over larger districts with more extensive inventory.
Top 10 Fastest Selling School Districts in the St Louis Metro Area
There were 31,960 homes sold in the St. Louis metro area during the 12-month period ending March 31, 2024, as the chart below from MORE, REALTORS® exclusively illustrates. This represents a 25% decline from the number of sales for the same period a year ago. While this is a slight increase from the 12-month sales low of 31,775 homes for the period ending December 31, 2023, it’s the lowest sales volume for this period since March 2015. Based on the chart, it appears that the trend of declining home sales has ended, as it has remained fairly flat over the last 8 months.
During the most recent 12-month period, homes in the St. Louis metro area sold for a median price of $170 per foot, marking an increase of about 7.5% from the same period a year ago.
St Louis MSA 12-Month Home Sales and Price Trend – Past 15 Years (Chart)
The real estate market in St. Louis is notably diverse, featuring homes that are, on average, quite affordable. However, this affordability doesn’t preclude the existence of luxury markets within the city. Presented below is an exclusive list from MORE, REALTORS® detailing the top 10 cities in the St. Louis MSA where homes command the highest average selling prices.
Key takeaways from this list include:
Huntleigh dominates with the highest average sale price of $2,097,249 and impressively quick transactions, with homes spending an average of just 20 days on the market. It’s important to note that these figures are based on a limited sample of only four home sales.
Frontenac and Town and Country are not far behind, boasting substantial average prices of $1,436,364 and $1,389,021, respectively. The volume of sales in these areas—46 and 68 homes sold—points to a healthy and active market.
Clayton and Ladue marry luxury with lively market activity, seeing 103 and 148 homes sold at steep average prices of $1,372,398 and $1,330,002, respectively.
Additional cities such as Westwood, Josephville, Town and Country, and Clarkson Valley also feature on the list, each contributing unique market traits but collectively underscoring the strong demand for high-end residential properties in the area.
St Louis MSA’s Most Expensive Cities-Avg Price-Homes Sold In Past Year
The St. Louis MSA residential real estate market is experiencing a phase of transformation. While the sales volume has seen a downturn, median sale prices have held steady, indicating a resilient market underpinned by solid demand. The complete STL Market Reports for the entire metro area as a whole, as well as the major counties, are available exclusively from MORE, REALTORS® and are below.
Key Findings:
Sales Volume Decline: The St. Louis MSA experienced a 9.30% decrease in the number of homes sold during the 12-month period ending March 31, 2024, compared to the previous year.
Median Sold Price Growth: Despite decreased sales, median sold prices rose by 2.40% from $248,000 to $253,950 during the same period.
Price Per Square Foot (PPSF): The PPSF of current listings is 3.74% than the PPSF of homes that sold during the prior 12-months. This suggests an adjustment in the market with current listings being priced lower than what was sold in the past year.
Inventory and Supply: There is currently a 1.07 months supply of homes for sale, indicating a tight inventory reflective of a seller’s market.
Median days on the market: The median time on the market of current listings is just 22 days, showing homes are selling relatively quickly.
County Highlights:
St. Louis City and St Louis County:
A decrease of -5.14% in homes sold year-over-year.
A reduction in median sold price by -1.21%.
A significant drop in PPSF for current listings by -15.93% compared to the last 12 months.
St. Charles County:
The number of homes sold dropped by -14.64%.
Median sold prices increased by 5.97%.
PPSF for current listings increased by 12.61%, signaling strong market growth.
Franklin County:
A decrease of -9.72% in homes sold year-over-year.
Median sold prices increased by 9.09%.
PPSF for current listings rose by 8.86%.
Jefferson County:
The number of homes sold decreased by -16.63%.
An increase in median sold prices by 4.02%.
A substantial increase in PPSF for current listings by 12.63%.
Market Implications:
The St. Louis MSA real estate market is currently defined by a decrease in the number of homes sold but a general uptrend in prices. The PPSF analysis reveals a market correction, yet the trend suggests prices might increase shortly.
For Sellers: The current market presents an opportunity due to low inventory levels and a consequent seller’s market, indicated by the low months’ supply.
For Buyers: The decreased competition and market adjustment could benefit buyers, yet they should be mindful of the resilient pricing trends.
The real estate landscape in the St. Louis metro requires careful navigation, with sellers possibly leveraging the low supply and buyers staying cautious of the potential for increasing prices. Stay informed with St. Louis Real Estate News for ongoing analysis and insights into local market trends.
The St. Louis Metro area (MSA), which spans parts of Missouri and Illinois, has a diverse real estate market with some zip codes seeing properties sell much faster than others. Based upon the report below, available exclusively from MORE, REALTORS®
, the fastest selling zip code in the area is 63070 in Jefferson County, Missouri where the current average days on market for active listings is just 12 days. Close behind in second place is 63040 in St. Louis County with 9 listings averaging 15 DOM. Rounding out the top five are 63134 (St. Louis County, 16 DOM), 63038 (St. Louis County, 17 DOM), and 63052 (Jefferson County, 20 DOM). The City of St. Louis makes its first appearance at #9 with 63021 and its 17 listings averaging 27 DOM.
Notably, 8 of the top 10 fastest-selling zips are located in Missouri counties, with just two from the Illinois side of the MSA – 62254 in St. Clair County at #14 and 62035 in Madison County at #15.
Fastest Selling Zip Codes in St Louis
(click on table for complete list with current data)
As we close the first quarter of 2024, it’s an opportune moment to revisit the forecasts I made at the end of last year regarding the St. Louis real estate market. With the data from January through March now available, we can assess the accuracy of the initial predictions and adjust our outlook for the remainder of the year.
Scorecard on December Predictions:
2024 Home Sales Forecast: I projected a slight decrease in the annual sales volume to about 22,400 homes. The data from the first quarter shows a varied trend with the 12-month home sales at the end of each month being:
January: 22,702 sales
February: 22,836 sales
March: 22,690 sales
These numbers suggest a relatively stable market, albeit with a slight variance from the predicted downward trend. The sales in February exceeded expectations, hinting at a possibly more dynamic market than initially forecasted.
2024 Home Prices Forecast: I anticipated a modest increase in home prices to peak around $196/foot in the summer, followed by a leveling off to approximately $184/foot by year-end. The first quarter showed median prices per foot as follows:
January: $175/foot
February: $178/foot
March: $186/foot
The March figure aligns closely with the expected summer peak. This rapid ascent in prices suggests a stronger upward momentum in the housing market than forecasted, possibly reflecting tighter inventory or increased demand.
Updated Forecast for 2024:
Given the trends observed in the first quarter, I am revising my forecast for the St. Louis real estate market in 2024 as follows:
Home Sales: The initial months of 2024 demonstrate a robustness that might offset the predicted decline. While the fluctuation in monthly sales advises caution, the overall stability could mean ending the year closer to 22,700 home sales, slightly above the early prediction.
Home Prices: The quicker than anticipated rise in median prices per foot, particularly the jump in March, prompts an upward revision in the price forecast. Should this trend persist, we might see the peak prices approaching $200/foot by mid-year, with a less pronounced decline towards year-end, potentially stabilizing around $190/foot.
A Word of Caution:
As always, this forecast is contingent on prevailing economic conditions, including interest rates and inflation trends. Significant deviations in these or other macroeconomic factors could impact the market differently than expected.
In summary, the St. Louis housing market is showing signs of robust activity and price growth in the first quarter of 2024. Buyers and sellers should stay informed and agile, ready to adjust to the dynamic market conditions.
St Louis 5-County 12-Month Home Sales and Price Trend
The St. Louis Metro residential real estate market in 2024 is showcasing diverse trends, indicating an evolving landscape for buyers, sellers, and industry professionals. The latest data, detailed in the STL Market Report exclusively from MORE, REALTORS®, offers a snapshot of these dynamics.
Contrasting Sales Trends:
There’s a notable decrease in home sales volume by 16.11% in the past year, with figures declining from 38,173 to 32,022 homes sold.
Home Value Resilience:
Despite the lower sales volume, median sold prices in the metro area nudged upward by 2.44%, moving from $246,000 to $252,000 year-over-year.
Price Per Square Foot (PPSF) Analysis:
The average PPSF for homes sold over the last 12 months stands at $173.85. Listings this month are somewhat lower at $163.46 PPSF.
Active listings for the month are quoted at a PPSF of $165.00, indicating a tentative increase in asking prices.
Signs of Market Adjustment:
A reduction in PPSF by 5.09% for current listings compared to the PPSF of homes sold in the past year hints at a market adjustment.
The current price trend arrow points upwards, suggesting that prices might be starting to rise again despite the recent cooling off.
Inventory and Supply Dynamics:
With 2,498 listings currently for sale and 2,051 homes sold last month, inventory levels are tight.
The months’ supply of inventory is low at 1.22, indicative of a seller’s market.
Homes are selling relatively swiftly, with the median number of days on the market being 27.
The St. Louis Metro real estate market’s recent performance, detailed in the report shown below, reveals a complex picture. Sales volume is down, yet home values are resilient, even with the lower PPSF for current listings. This discrepancy suggests that, although the pace of sales has slowed, the demand remains robust enough to support current price levels.
Sellers might see this as an opportunity, given the scarcity of inventory and the seller’s market indicated by the low months’ supply. However, buyers may benefit from less competition, even as they face persistent price strength. It’s a pivotal time for the market, and those involved will need to navigate these mixed signals with strategic planning and sound advice from experienced real estate professionals.
Stay tuned to St. Louis Real Estate News for detailed analyses and updates on our local market trends.
The dynamics of the new home market are shifting significantly as we advance into 2024, with a clear trend towards smaller, more personalized living spaces emerging nationwide. This evolution reflects a broader change in homeowner preferences and market conditions, according to the latest “What Home Buyers Really Want” study by the National Association of Home Builders (NAHB).
Recent data points to a decline in the average size of new homes, continuing a trend that began following a brief uptick in 2021. The average new home size has decreased to 2,411 square feet in 2023, marking the smallest average size in over a decade. This reduction aligns with homebuyers’ preferences, which have also shifted towards more compact living spaces. Today, the desired home size is around 2,070 square feet, significantly less than the 2,260 square feet preferred two decades ago.
Rose Quint, NAHB’s assistant vice president of survey research, identifies two main factors driving this trend: a change in homebuyer preferences and the escalating challenge of housing affordability. In response, builders are adapting their strategies, with 38% reporting a shift towards constructing smaller homes in 2023 to facilitate sales, and 26% planning to continue this approach into 2024. Efforts to address affordability concerns have led to reductions in median new home prices to $427,400 in 2023, a 7 percentage point drop from the previous year and the most significant decrease since 2009.
Beyond size, homebuyers are increasingly seeking personalized and authentic living spaces. Donald Ruthroff, AIA, of Design Story Spaces LLC, highlights a growing demand for customization, with homeowners desiring unique features that set their homes apart. This trend towards personalization is evident in the choice of home upgrades, from custom kitchen islands to premium flooring options.
The study also reveals that homebuyers’ priorities have evolved, with a focus on outdoor living, kitchen functionality, and energy efficiency. Top desired features include laundry rooms, patios, Energy Star windows, and smart home technology, such as security cameras and programmable thermostats. Additionally, preferences have expanded to include quartz countertops, outdoor kitchens, and built-in seating, underscoring a shift towards both practicality and luxury in home design.
As we move through 2024, the shift towards smaller, more personalized homes is reshaping the real estate landscape. This trend, driven by changing preferences and affordability challenges, highlights the importance of staying informed about market dynamics for both homebuyers and builders and you’re in the right place now to do that, St Louis Real Estate News.
As 2023 drew to a close, the St. Louis metro real estate market concluded the year with a total of 31,747 homes sold. As highlighted in the chart below, this figure represents the lowest annual home sales in the St. Louis MSA in nine years, since 2014, when the total was 31,531 homes sold.
Home prices in the St. Louis MSA have shown more resilience than sales volumes. As 2023 came to a close, the 12-month median home price per foot stood at $169, marking a 5% increase from the previous year. This trend provides a stark contrast to the sales figures. Over the past nine years, while the number of homes sold initially rose, it eventually reverted to levels seen nine years ago. In contrast, the median price per foot for homes sold has witnessed a substantial increase of over 74%, soaring from $97 per foot to $169 per foot.
12-Month Home Sales and Price Trend For the St Louis MSA For the Past 15 Years
In their report, “A Surfeit of Real Estate Agents: Industry and Consumer Impacts,” the Consumer Federation of America (CFA) sheds light on a pressing issue in the real estate industry: the overwhelming number of agents. This surplus, as detailed in the report, is not just a numbers game; it’s a matter of market efficiency and service quality, deeply affecting both agents and consumers in markets like St. Louis.
While I may not always agree with the Consumer Federation of America’s views, including certain aspects of this report, many of their points echo my own observations at MORE, REALTORS®. We constantly strive to enhance our agents’ education and consumer knowledge, while also improving service quality for home buyers and sellers through innovative technology. This proactive approach in real estate brokerage sets us apart, enabling us to anticipate and address potential industry issues, often identified by external observers like the CFA, before they escalate.
Some of the problems identified in the report, with each point followed by my thoughts, are:
Agent Over-saturation: The influx of part-time agents has saturated the market, impacting incomes and service quality.
The recent strong sellers’ market created a misleading ease in real estate success, attracting numerous new agents. As the market normalizes, many realize the need for deeper knowledge and commitment to provide professional service. At MORE, we understand this isn’t just about numbers; it’s about upholding excellence.
Professional Development: The report emphasizes the importance of continuous professional development and specialization to differentiate full-time agents from part-timers.
I wholeheartedly agree with the report’s emphasis on continuous professional development. At our company, I lead weekly online coaching and training sessions, attended by our agents. We don’t just stop at a salesperson’s license in Missouri; we encourage further education, including obtaining a broker’s license and professional designations, to demonstrate our commitment to excellence.
Technology and Efficiency: Utilizing technology to enhance efficiency and reduce operational costs, thereby allowing full-time agents to remain competitive and profitable.
While the report discusses technology from an agent profitability standpoint, I view it as a tool for providing more data and resources to clients efficiently and effectively, thereby maximizing the value delivered by our agents.
Consumer Education: Educating consumers about the value of experienced, full-time agents to ensure better service quality and market efficiency.
This is a crucial area for me. For over 14 years, I’ve been actively writing articles and sharing insights on St Louis Real Estate News, aiming to educate both consumers and agents. An informed consumer base leads to better decisions, rewarding high-quality, professional agents.
In conclusion, the CFA’s report “A Surfeit of Real Estate Agents: Industry and Consumer Impacts” illuminates significant challenges in today’s market, particularly the glut of agents. At MORE, REALTORS®, we’ve been proactive in addressing these issues through continuous professional development, technological advancement, and consumer education. Our approach isn’t just about adapting to current trends; it’s about setting a higher standard in real estate service. As we navigate these industry changes, our commitment to excellence and informed service remains our guiding principle, ensuring we continue to deliver unmatched value to our clients in St. Louis.
A Surfeit of Real Estate Agents: Industry and Consumer Impacts
The “STL Market Report,” below exclusively available from MORE, REALTORS, provides a comprehensive look at the St. Louis residential real estate market as 2023 ended. This report outlines a mixed array of trends, highlighting a notable decline in the number of homes sold contrasted with a modest increase in median sold prices, offering in-depth knowledge for prospective buyers and sellers to navigate the market.
Decrease in Home Sales Volume
The St. Louis metro area witnessed a noticeable reduction in the volume of home sales year-over-year. A total of 31,704 homes were sold in the year ending December 2023, which marks a 13.13% decrease compared to the previous year’s figure of 36,498. This drop could signal a shift toward a buyer’s market, as fewer transactions typically indicate less competition among buyers.
Modest Rise in Home Prices
Despite the decrease in sales volume, St. Louis saw a modest increase in home prices. The median sold price for homes rose by 2.04% from $245,000 in December 2022 to $250,000 in December 2023. This growth, although not steep, suggests that home values in the region continue to appreciate, offering a silver lining for homeowners looking to sell.
Price Per Square Foot Analysis
The median price per square foot (PPSF) for sold homes remained relatively stable at $173.08 in December 2023, a slight decrease compared to the median PPSF for current listings at $171.87. However, a significant point to note is the 11.02% drop in PPSF for current listings compared to the sold listings from the past 12 months, indicating a possible adjustment in market expectations.
Inventory and Market Supply Dynamics
St. Louis’s home inventory levels also present an interesting narrative. With 2,956 listings currently up for sale and 2,348 homes sold last month, the market is experiencing a supply of approximately 1.26 months. This figure represents a brisk market that favors sellers, as a supply under 6 months typically does. However, it is important to monitor whether this inventory will rise or fall in response to changing market conditions.
Days on Market: A Consistent Pace
Homes in St. Louis are selling at a consistent pace, with the median days on market holding steady at 37 days. This indicates a stable demand for homes, with properties moving from listing to sale in just over a month on average.
What This Means for You
For sellers in the St. Louis area, the market still offers a favorable environment with steady prices and a relatively quick selling period. Buyers, on the other hand, might benefit from reduced competition, though they should be mindful of potential value appreciations.
As 2024 approaches, I conducted my customary in-depth analysis of historical St. Louis real estate market data to get my projection for St. Louis home sales and prices. Home sales in the five-county St. Louis core market appear to be gradually declining, based on statistics and trends from the previous ten years, as seen in the chart below
2024 St Louis Home Sales…
The data for the 12-month period ending December 31, 2023, will be available in a few days. I anticipate that home sales will be roughly 22,600 for the year, but there will be a slight decline by the end of 2024, bringing St Louis home sales down to about 22,400. This isn’t a huge drop (0.8%), but it is a noticeable change that could give buyers in the market a bit more leeway.
2024 St Louis Home Prices…
While home prices have been on the rise, the median price per square foot is increasing at a slower rate than in previous years. I anticipate St. Louis home prices will increase by only about 1% from their 2023 peak, reaching a peak in the summer of 2024 at approximately $196/foot, and then leveling off slightly, falling to around $184/foot by December 2024. It’s important to bear in mind that this type of fluctuation is common, whether you’re buying or selling. Prices are not falling dramatically, but they’re also not rising sharply. This follows a more consistent, dependable pattern. These are the trends to watch out for in the St. Louis market in 2024 if you’re in the game.
A little CYA…
It’s worth noting that the aforementioned estimates are based on the current economic conditions and patterns. Interest rates, inflation, and unemployment are just a few of the many factors that influence the economy, and even experts (who know a lot more than me) can’t always agree on where these trends are headed. As a result, any major shifts in these areas might significantly impact the direction of the St. Louis housing market in the upcoming year.
St Louis 5-County Core 12-Month Home Sale and Price Trend – Past 10 Years
In a remarkable end-of-year surge, the St. Louis real estate market has shown significant growth in both home sales and new listings, according to the latest reports below, available exclusively from MORE, REALTORS®. The week of December 17-23, 2023, marked a notable increase in accepted contracts for home sales, jumping 26% compared to the same week in 2022. The rise was led by St. Louis County, which experienced an impressive 60% increase, indicating a robust demand in this area.
Simultaneously, new listings in the St. Louis area rose by 10%, with St. Charles County, in particular, witnessing a 31% jump in new properties hitting the market followed by Jefferson County with a 20% increase in new listings over the prior year.
This increase in listings, coupled with the growth in sales, suggests a continued good real estate environment as we head into the new year.
STL Real Estate Trends Report
New Accepted Contracts In the St Louis 5-County Core Market
A report just released by ATTOM Data Research details housing affordability for the largest counties in the St. Louis metro area for the 3rd quarter of 2023. Affordability, measured by the percentage of wages needed to buy a home, shows considerable variation across counties in Illinois and Missouri. This metric is influenced by factors such as median sales prices and average wages.
For instance, in the County of St. Louis City (yes, it’s odd, but it’s a county), it only takes 17.3% of the annualized wages of an average earner to buy a median-priced home. In contrast, in St. Charles County, it takes 38.3% of annualized wages to afford a home. As the table below illustrates, in 4 of the 7 counties covered in the report, an average wage earner could afford to buy a home. Interestingly, home price appreciation is outpacing annualized wages in those counties, indicating that this affordability may soon change.
Percentage Of Income Needed To Buy A Home In St Louis
The real estate industry is potentially on the cusp of a significant shift, one that could redefine the relationship between homebuyers, sellers, and their agents. Several class-action lawsuits, including the Sitzer v. NAR case decided in favor of the plaintiffs last month, have brought considerable attention to how real estate agents representing buyers are compensated. Consequently, many in the industry, myself included, anticipate that changes prompted by either court order or regulation could significantly impact everyone involved in the home buying and selling process
For Buyers: Empowerment through Transparency
Historically, buyer’s agents have been compensated by the seller, creating a perception of “free service” for the buyer. This arrangement often obscured the true cost of services provided by buyer’s agents. The anticipated changes would likely result in a direct payment model, where buyers would pay their agents directly.
What does this mean for you as a buyer? Firstly, it brings transparency. You will have a clearer understanding of what you’re paying for and why. It’s an opportunity to engage more deeply with your agent, understanding their role and the value they bring to your home-buying journey. This shift encourages informed decision-making and could lead to more personalized, high-quality services, as agents strive to demonstrate their worth.
For Sellers: A More Level Playing Field
Sellers, you’re not left out of this equation. The change could level the playing field, making the process fairer. You might find that the costs of selling your home become more predictable, and the overall market dynamics more balanced. However, sellers may experience a bit of ‘sticker shock’ initially. When selling, and basing the value of their home on recent sales, they will need to remember that those prior sale prices included the cost of the buyer’s agent. If now the buyer has to incur this cost, it will effectively add to the buyer’s overall expenses and, consequently, lower the perceived value of the home compared to listings where the seller paid the commission. In other words, sellers, you can’t have your cake and eat it too.
For Agents: A Call to Elevate Services
To the real estate professionals reading this: the proposed changes are a call to action. This is an opportunity to showcase the value and expertise you bring to the table. By focusing on quality service, specialization, and client satisfaction, you can navigate these changes successfully. Remember, a more informed consumer is an opportunity to build deeper, trust-based relationships.
A Forward-Looking Industry
Change is often accompanied by uncertainty, but it also brings growth and progress. As we navigate this evolving landscape, our focus remains on empowering you with information and insights. Whether you’re buying, selling, or simply exploring the market, remember: the value of a skilled real estate professional is undisputed. The right agent is your ally, advocate, and expert. If you are looking for such an agent, a good place to start is my firm, MORE, REALTORS® as those are the only kind of agents we surround ourselves with (shameless plug).
In the ever-shifting sands of the real estate market, timing can be the key to unlocking exceptional value. A recent comprehensive study by ATTOM Data Services, which analyzed over 47 million home sales, uncovers a surprising twist specific to the Missouri housing market. While the national trend leans towards October for optimal home buying, Missouri charts a different course, offering a unique window of opportunity for prospective buyers.
Discovering Missouri’s Seasonal Advantage
This extensive study paints a vivid picture of real estate trends, providing invaluable insights for both buyers and sellers. For Missouri, the findings point to December as a golden month for home purchasing, differing from the national trend. This divergence presents a strategic opportunity for buyers in the state to potentially secure better deals.
What This Means for St. Louis Home Buyers and Sellers
In the St. Louis real estate market, the latest data presents a compelling narrative for immediate buyer action. With December’s arrival, historically marked as the most advantageous month for home purchases in Missouri, buyers are positioned to capitalize on potentially lower prices. This trend aligns closely with the findings from my recent analysis on interest rates dropping to their lowest in over two months. Together, these factors create a prime environment for buyers in the current market. For sellers, this period warrants a strategic review to align with the unique opportunities that December offers.
For the 12-month period ended October 31, 2023, there were 3,097 condominiums sold in the St Louis 5-county core market which, as the Condo 12-Month Sales and Price Trend Chart below (available exclusively from MORE, REALTORS®) shows, is the lowest total for 12-month sales since August 2014. The St Louis Condominium sales trend is faring slightly better than single-family homes sales are because, as I reported earlier this week, St Louis home sales have fallen to the lowest level since early 2013.
St Louis Condo prices increasing a slower pace….
As the chart at the bottom illustrates, the median price per foot for Condominiums sold in the St Louis area increased this year 8.1% from last year which, while it is a higher percentage increase than seen during the same period for homes, is a lower rate of price appreciation than the 11.0% seen in 2022 and 9.0% in 2021.
St Louis Condo 12-Month Sales Trend and Price Trend
Missouri Online Real Estate, Inc. 3636 South Geyer Road - Suite 100, St Louis, MO 63127 314-414-6000 - Licensed Real Estate Broker in Missouri
The owner and authors this site are providing the information on this web site for general informational purposes only and make no representations, warranties (expressed or implied) or guarantees of any kind whatsoever, as to the accuracy or completeness of any information on this site or of any information found by following any link on this site. Furthermore, the owner and authors of this site will not be liable in any manner whatsoever for any errors or omissions in information on this site, nor for the availability of this information. Additionally the owner and authors of this site will not be liable for for any losses, injuries or damages in any way from the display or use of this information or as the result of following external links displayed on this site, or by responding to advertisements displayed, or contained, on this site
In using this site, users acknowledge and agree that the information on this site does not constitute the provision of legal advice, tax advice, accounting services, investment advice, or professional consulting of any kind nor should it be construed as such. The information provided herein should not be used as a substitute for consultation with professional tax, accounting, legal, or other competent advisers. Before making any decision or taking any action on this information, you should consult a qualified professional adviser to whom you have provided all of the facts applicable to your particular situation or question. None of the tax information on this web site is intended to be used nor can it be used by any taxpayer, for the purpose of avoiding penalties that may be imposed on the taxpayer.
All of the information on this site is provided as is, with no assurance or guarantee of completeness, accuracy, or timeliness of the information, and without warranty of any kind, express or implied, including but not limited to warranties of performance, merchantability, and fitness for a particular purpose.
This site contains external links to other sites not owned or controlled by the owner of this site, therefore the owner of this site does not control or guarantee in any manner the accuracy or relevancy of any information obtained through following such links. Links contained on this site are for users convenience and users should exercise extreme caution when following links. Including a link on this site does not constitute an endorsement of the site linked to or any views or opinions expressed on the site, products or services offered on outside sites or the companies or organizations that own and operate outside sites.
This site may accept payment for advertising, for displaying advertisements, through affiliate relationships with companies or may receive referral fees or commissions from companies as a result of recommending or referring people to a website. This site may also accept free product samples, free services, gift cards or cash to review a product or service. All paid and sponsored content may not always be identified as such. Any product claim, quote or other representation about a product or service should be verified with the manufacturer or provider.