By Dennis Norman, on March 7th, 2024 In the 12-month period ended January 31, 2024 the St. Louis area saw the issuance of 3,996 building permits for new single-family homes. This represents a decline of 3.64% compared to the previous 12-month period, which had 4,147 permits, according to the latest figures from the Home Builders Association of St. Louis & Eastern Missouri (St. Louis HBA). This downward trend was noted across all counties with the exception of St. Charles County, with two counties reporting double-digit decreases.
Search St Louis Homes For Sale Search St Louis New Homes For Sale
St Louis New Home Building Permits Continue Reading →
By Dennis Norman, on March 4th, 2024 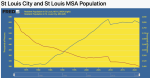
As the table and charts below illustrate, the St. Louis Metropolitatn Area (MSA) has undergone significant demographic shifts over the past 50 years, marked by a stark contrast between the population trends in the City of St. Louis and its surrounding counties.
St Louis MSA and Major Counties Population 1970-2022
The decline in the City of St. Louis’s population sharply contrasts with the growth in surrounding counties. During the same period that St. Charles County witnessed a 345% increase and the St. Louis MSA as a whole saw nearly a 60% rise, the City of St. Louis Continue Reading →
By Dennis Norman, on February 8th, 2024 In 2023, the St. Louis area saw the issuance of 3,891 building permits for new single-family homes. This represents a decline of 10.78% compared to the previous year, which had 4,361 permits, according to the latest figures from the Home Builders Association of St. Louis & Eastern Missouri (St. Louis HBA). This downward trend was noted across all counties with the exception of St. Charles County, where five counties reported double-digit decreases. Additionally, Warren County, which had been on a four-month streak of increased permit activity, experienced a slight drop this month. The total of 3,891 permits in 2023 is Continue Reading →
By Dennis Norman, on January 8th, 2024 The “STL Market Report,” below exclusively available from MORE, REALTORS, provides a comprehensive look at the St. Louis residential real estate market as 2023 ended. This report outlines a mixed array of trends, highlighting a notable decline in the number of homes sold contrasted with a modest increase in median sold prices, offering in-depth knowledge for prospective buyers and sellers to navigate the market.
Decrease in Home Sales Volume The St. Louis metro area witnessed a noticeable reduction in the volume of home sales year-over-year. A total of 31,704 homes were sold in the year ending December 2023, which marks Continue Reading →
By Dennis Norman, on December 26th, 2023 In a remarkable end-of-year surge, the St. Louis real estate market has shown significant growth in both home sales and new listings, according to the latest reports below, available exclusively from MORE, REALTORS®. The week of December 17-23, 2023, marked a notable increase in accepted contracts for home sales, jumping 26% compared to the same week in 2022. The rise was led by St. Louis County, which experienced an impressive 60% increase, indicating a robust demand in this area.
Simultaneously, new listings in the St. Louis area rose by 10%, with St. Charles County, in particular, witnessing a 31% jump Continue Reading →
By Dennis Norman, on December 21st, 2023 A report just released by ATTOM Data Research details housing affordability for the largest counties in the St. Louis metro area for the 3rd quarter of 2023. Affordability, measured by the percentage of wages needed to buy a home, shows considerable variation across counties in Illinois and Missouri. This metric is influenced by factors such as median sales prices and average wages.
For instance, in the County of St. Louis City (yes, it’s odd, but it’s a county), it only takes 17.3% of the annualized wages of an average earner to buy a median-priced home. In contrast, in St. Charles Continue Reading →
By Dennis Norman, on November 16th, 2023 The St. Louis Real Estate Market Report for October 2023, presented below, merges data from both the City and County of St. Louis. This infographic is a unique offering from MORE, REALTORS, which is renowned for its expertise in St. Louis real estate market intelligence. Additionally, our brokerage prides itself on having a team of the most experienced and knowledgeable agents who are deeply committed to serving our clients throughout the St. Louis metro area
We invite you to dive deeper into our comprehensive demographic, which also sheds light on the St Charles, Jefferson and Franklin County markets as well Continue Reading →
By Dennis Norman, on November 5th, 2023 For the 12-month period ended October 31, 2023, there were 22,555 homes sold in the St Louis 5-county core market which, as the STL Market Report below (available exclusively from MORE, REALTORS®) shows, is a 17.38% decline in home sales from the the prior 12-month period when there were 27,200 homes sold. The median price of homes sold during the most recent 12-month period was $275,000, an increase of 3.777% from the prior 12-month period.
St Louis home sales trend continues to fall….
Below the market report is a STL Market Chart showing (also available exclusively from MORE, REALTORS®) Continue Reading →
By Dennis Norman, on November 4th, 2023 The St. Louis Real Estate Market Report for September 2023, presented below, merges data from both the City and County of St. Louis. This infographic is a unique offering from MORE, REALTORS, which is renowned for its expertise in St. Louis real estate market intelligence. Additionally, our brokerage prides itself on having a team of the most experienced and knowledgeable agents who are deeply committed to serving our clients throughout the St. Louis metro area
We invite you to dive deeper into our comprehensive demographic, which also sheds light on the St Charles, Jefferson and Franklin County markets as well Continue Reading →
By Dennis Norman, on October 6th, 2023 The St. Louis real estate market is experiencing a fascinating divergence in trends between luxury and non-luxury homes. According to the latest data from MORE, REALTORS®, the market for luxury homes—those priced at $750,000 and above—is on the rise, reaching its highest level in eight months. In contrast, the market for non-luxury homes, priced below $750,000, has been on a steady decline for about two years. This article delves into these trends, referencing two illuminating charts from MORE, REALTORS®.
Luxury Home Sales on the Upswing
The first chart from MORE, REALTORS® illustrates the upward trajectory of luxury home sales in Continue Reading →
By Dennis Norman, on October 2nd, 2023 According to the latest MLS data reported by MORE, REALTORS®, there is currently a 1.38-month supply of homes for sale in the 5-county core market of St. Louis. While this may not seem like a significant inventory, it’s worth noting that for the past few years, the supply was below half a month. It gradually increased to over one month and reached 1.38 months at the end of September. This represents the highest level of inventory, based on months’ supply, that the St. Louis area has seen in over three years. However, this is still well below the Continue Reading →
By Dennis Norman, on September 29th, 2023 As a result of rising interest rates and home prices at levels higher than increases in income, homes in St Louis continue to become less affordable. In fact, according to data just released by ATTOM Data Research, home affordability declined double digits during the 3rd quarter of this year in all five counties that make up the St Louis core market. As the info graphic below illustrates, the percentage of wages needed to buy a home have, depending upon county, increased about a third to almost half from the historical “norm”.
Least affordable ever…
Three of the five counties that Continue Reading →
By Dennis Norman, on September 13th, 2023 The St Louis Real Estate Market Report for August 2023 is below and combines data for the City and County of St Louis.  This data is presented by MORE, REALTORS, recognized as a leading authority in St Louis real estate market intelligence.  We invite you to dive deeper into our comprehensive demographic, which also sheds light on the St Charles, Jefferson and Franklin County markets as well by tapping on the image below.
Navigating the St Louis property landscape requires precision…
In the current property climate, likened to a complex chess match, the price for ill-informed decisions can be high. Continue Reading →
By Dennis Norman, on August 14th, 2023 Below is the St Louis Real Estate Market Report for July 2023 for the City and County of St Louis combined from MORE, REALTORS®, one of the most trusted sources for St Louis real estate market data and information. You can access the full infographic, containing data for St Charles, Jefferson and Franklin Counties as well by clicking on the image below.
The current St Louis real estate market leaves little room for errors…
The real estate market today is like a tough game where making wrong decisions based on poor information can cost you. With few homes listed and Continue Reading →
By Dennis Norman, on July 14th, 2023 Below is the St Louis Real Estate Market Report for June 2023 for the City and County of St Louis combined from St Louis Real Estate Search (the Official site). You can access the full infographic, containing data for St Charles, Jefferson and Franklin Counties as well by clicking on the image below.
In the relentless tug-of-war that characterizes today’s real estate market, it’s imperative not to base your choices on misguided data!
The present property market leaves little room for errors, thanks to a deficit of listings and aggressive buyer interest. A combination of these factors has sparked not Continue Reading →
By Dennis Norman, on July 5th, 2023 For the 12-month period ended June 20, 2023, there were 23,074 homes sold in the St Louis 5-county core market which, as the STL Market Report below (available exclusively from MORE, REALTORS®) shows, is nearly a 20% decline in home sales from the the prior 12-month period when there were nearly 29,000 homes sold. The median price of homes sold during the most recent 12-month period was $270,000, an increase of 5.47% from the prior 12-month period.
St Louis home sales trend continues to fall….
Below the market report is a STL Market Chart showing (also available exclusively from Continue Reading →
By Dennis Norman, on June 15th, 2023 Below is the St Louis Real Estate Market Report for May 2023 for the City and County of St Louis combined from St Louis Real Estate Search (the Official site). You can access the full infographic, containing data for St Charles, Jefferson and Franklin Counties as well by clicking on the image below.
In this competitive market don’t make decisions based upon bad data!
Today’s real estate market is unforgiving for homebuyers, driven by a scarcity of inventory and robust buyer demand. This, coupled with not just bidding wars but “terms wars”, has made it challenging for many. In an Continue Reading →
By Dennis Norman, on June 8th, 2023 Last month, there were 460 properties with foreclosure filings in the St Louis MSA, according to ATTOM Data’s U.S. Foreclosure Market Report. This represents an increase of 36% in St Louis foreclosures from April 2023 to May 2023 and a 28% increase from a year ago.
Counties of Macoupin, St Charles and St Louis see biggest increases…
As the table below shows, Macoupin County in Illinois saw an increase of 113% in foreclosure activity in May from the month before, St Charles County a 71% increase and St Louis County a 67% Increase.
[xyz-ips snippet=”Foreclosures-For-Sale-and-Homes-For-Sale”]
St Louis Foreclosures – May Continue Reading →
By Dennis Norman, on May 12th, 2023 Below is our St Louis Real Estate Market Report for April 2023 for the City and County of St Louis combined. You can access the full infographic, containing data for St Charles, Jefferson and Franklin Counties as well by clicking on the image below.
Search St Louis Homes For Sale Search St Louis Upcoming OPEN HOUSES St Louis Real Estate Report for April 2023
(click on infographic for complete report including other counties)
Continue Reading →
By Dennis Norman, on April 13th, 2023 Below is our St Louis Real Estate Market Report for March 2023 for the City and County of St Louis combined. You can access the full infographic, containing data for St Charles, Jefferson and Franklin Counties as well by clicking on the image below.
Search St Louis Homes For Sale Search St Louis Upcoming OPEN HOUSES St Louis Real Estate Report for March 2023
(click on infographic for complete report including other counties)
Continue Reading →
By Dennis Norman, on March 17th, 2023 There were 28,500 homes sold in the St Louis 5-county core market during the 12-month period ended February, 28, 2023 a decline of 16.80% from the prior 12-months when 34,256 homes were sold according to MORE REALTORS® exclusive STL Market Report below. As the report below shows, the median price of homes sold in St Louis increased 7.62% during the same period.
While the supply of St Louis homes for sale is still historically very low, it has increased significantly over the past two years rising from under a 1-month supply to the current 1.64 month supply of homes currently Continue Reading →
By Dennis Norman, on March 13th, 2023 Below is our St Louis Real Estate Market Report for February 2023 for the City and County of St Louis combined. You can access the full infographic, containing data for St Charles, Jefferson and Franklin Counties as well by clicking on the image below.
Search St Louis Homes For Sale Search St Louis Upcoming OPEN HOUSES St Louis Real Estate Report for February 2023
(click on infographic for complete report including other counties)
Continue Reading →
By Dennis Norman, on March 9th, 2023
A new report just released by ATTOM Data revealed that nearly one of every four homeowners (24.3 %) in the city of St Louis that have a mortgage, are underwater on equity (meaning property owner owes at least 25% more on their home than the current value). At the other end of the spectrum was St Charles County where just 3.9% of homeowners with a mortgage are underwater.
Below is a list of the larger counties in the St Louis MSA and the percentage of the mortgages in the respective county that was underwater during the 4th Continue Reading →
By Dennis Norman, on February 7th, 2023 According to data released by ATTOM Data Research, during the fourth quarter of 2022, 42.37% of the homeowners with a mortgage within the 63376 zip code, were “equity-rich” meaning their mortgage balance was just 50% or less of the current value of their home. The table below shows the 10 St Louis zip codes with the highest percentage of equity-rich mortgages. Half of zip codes on the list are located within the St Charles County, four in St Louis County and one in Jefferson County
Also shown on the table is the percentage of homeowners with a seriously-underwater mortgage, meaning Continue Reading →
By Dennis Norman, on January 25th, 2023 There were 4,361 building permits issued for new single-family homes in the St Louis area during 2022, a decline of 9.62% from 2021 when there were 4,825 permits issued, according to the latest data from the Home Builders Association of St. Louis & Eastern Missouri (St Louis HBA). As the table below shows, 4 of the 7 counties included in the report had a decline in the number of permits issued in 2022 from the year before, with there of them double-digit declines. Lincoln County saw the biggest drop percentage-wise with a decline of 38.27% followed by St Charles County Continue Reading →
By Dennis Norman, on November 11th, 2022 Below is our St Louis Real Estate Market Report for October 2022 for the City and County of St Louis combined. You can access the full infographic, containing data for St Charles, Jefferson and Franklin Counties as well by clicking on the image below.
Search St Louis Homes For Sale Search St Louis Upcoming OPEN HOUSES St Louis Real Estate Report for October 2022
(click on infographic for complete report including other counties)
Continue Reading →
By Dennis Norman, on October 27th, 2022 As the tables below show, so far during October there have been 278 home sales closed in St Charles County, down 28% from the same period last year when there were 388 sales closed. The median sold price this month for those closed sales in St Charles County has been $337,000 an increase of over 12 percent from the same period last year when the median prices homes in St Charles County sold for was 300. Another bit of data which is illustrates the overbidding we’ve seen in the past that has quickly come to an end for the most Continue Reading →
By Dennis Norman, on October 21st, 2022 As the infographic below illustrates, the time active listings in St Louis have been on the market is much greater than the time it took homes that closed last month to sell. In addition, a much greater percentage of the current active listings have reduced their asking prices versus the sales that closed last month.
The most dramatic increase in days on the market was in St Charles County. Active listings in St Charles County have been on the market a median time of 38 days, almost 5 times as long as the sales that closed in September where the Continue Reading →
By Dennis Norman, on October 12th, 2022 As the STL Real Estate Trends report below shows, as of last week, 43% of the active listings in the St Louis 5-County core market have a current asking price that is lower than the initial asking price. This is more than a 100% increase from the same week last year when only 20% of the listings had a reduced asking price.
Franklin County saw the biggest increase in price reductions on listings from last year with an increase from 14% to 47%. Franklin County also has the highest percentage of active listings with a reduced price and St Charles Continue Reading →
By Dennis Norman, on October 11th, 2022 Below is our St Louis Real Estate Market Report for September 2022 for the City and County of St Louis combined. You can access the full infographic, containing data for St Charles, Jefferson and Franklin Counties as well by clicking on the image below. Worth noting and remembering is not all data is created equally nor is all of what you see reported accurate. Given the challenging and rapidly changing economic times we are in which are having an direct impact on the St Louis housing and real estate market, now, almost more than ever, you need to be sure Continue Reading →
|
Recent Articles
Helpful Real Estate Resources
|

