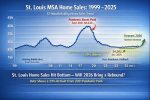
Smaller, Personalized Homes Dominate 2024 Trends: Insights from NAHB Study

The dynamics of the new home market are shifting significantly as we advance into 2024, with a clear trend towards smaller, more personalized living spaces emerging nationwide. This evolution reflects a broader change in homeowner preferences and market conditions, according to the latest “What Home Buyers Really Want” study by the National Association of Home Builders (NAHB).

Recent data points to a decline in the average size of new homes, continuing a trend that began following a brief uptick in 2021. The average new home size has decreased to 2,411 square feet in 2023, marking the smallest average size in over a decade. This reduction aligns with homebuyers’ preferences, which have also shifted towards more compact living spaces. Today, the desired home size is around 2,070 square feet, significantly less than the 2,260 square feet preferred two decades ago.

Rose Quint, NAHB’s assistant vice president of survey research, identifies two main factors driving this trend: a change in homebuyer preferences and the escalating challenge of housing affordability. In response, builders are adapting their strategies, with 38% reporting a shift towards constructing smaller homes in 2023 to facilitate sales, and 26% planning to continue this approach into 2024. Efforts to address affordability concerns have led to reductions in median new home prices to $427,400 in 2023, a 7 percentage point drop from the previous year and the most significant decrease since 2009.

Beyond size, homebuyers are increasingly seeking personalized and authentic living spaces. Donald Ruthroff, AIA, of Design Story Spaces LLC, highlights a growing demand for customization, with homeowners desiring unique features that set their homes apart. This trend towards personalization is evident in the choice of home upgrades, from custom kitchen islands to premium flooring options.

The study also reveals that homebuyers’ priorities have evolved, with a focus on outdoor living, kitchen functionality, and energy efficiency. Top desired features include laundry rooms, patios, Energy Star windows, and smart home technology, such as security cameras and programmable thermostats. Additionally, preferences have expanded to include quartz countertops, outdoor kitchens, and built-in seating, underscoring a shift towards both practicality and luxury in home design.

As we move through 2024, the shift towards smaller, more personalized homes is reshaping the real estate landscape. This trend, driven by changing preferences and affordability challenges, highlights the importance of staying informed about market dynamics for both homebuyers and builders and you’re in the right place now to do that, St Louis Real Estate News.


St Louis Metro Area Real Estate Market Report for January 2024 with accurate data you can trust

The St. Louis Metro Area Real Estate Market Report for January 2024, presented below, provides an overview of the St Louis real estate market for each county within the St Louis MSA. This infographic is a unique offering from MORE, REALTORS, which is renowned for its expertise in St. Louis real estate market intelligence. Additionally, our brokerage prides itself on having a team of the most experienced and knowledgeable agents who are deeply committed to serving our clients throughout the St. Louis metro area.

St Louis Metro Real Estate Report for January 2024

(click on infographic for complete report including all counties in the St Louis Metro Area)St Louis Metro Real Estate Report for January 2024

Market Overload: Report Reveals Surplus of Agents in Real Estate

In their report, “A Surfeit of Real Estate Agents: Industry and Consumer Impacts,” the Consumer Federation of America (CFA) sheds light on a pressing issue in the real estate industry: the overwhelming number of agents. This surplus, as detailed in the report, is not just a numbers game; it’s a matter of market efficiency and service quality, deeply affecting both agents and consumers in markets like St. Louis.

While I may not always agree with the Consumer Federation of America’s views, including certain aspects of this report, many of their points echo my own observations at MORE, REALTORS®. We constantly strive to enhance our agents’ education and consumer knowledge, while also improving service quality for home buyers and sellers through innovative technology. This proactive approach in real estate brokerage sets us apart, enabling us to anticipate and address potential industry issues, often identified by external observers like the CFA, before they escalate.


Some of the problems identified in the report, with each point followed by my thoughts,  are:

  • Agent Over-saturation: The influx of part-time agents has saturated the market, impacting incomes and service quality.
    • The recent strong sellers’ market created a misleading ease in real estate success, attracting numerous new agents. As the market normalizes, many realize the need for deeper knowledge and commitment to provide professional service. At MORE, we understand this isn’t just about numbers; it’s about upholding excellence.
  • Professional Development: The report emphasizes the importance of continuous professional development and specialization to differentiate full-time agents from part-timers.
    • I wholeheartedly agree with the report’s emphasis on continuous professional development. At our company, I lead weekly online coaching and training sessions, attended by our agents. We don’t just stop at a salesperson’s license in Missouri; we encourage further education, including obtaining a broker’s license and professional designations, to demonstrate our commitment to excellence.
  • Technology and Efficiency: Utilizing technology to enhance efficiency and reduce operational costs, thereby allowing full-time agents to remain competitive and profitable.
    • While the report discusses technology from an agent profitability standpoint, I view it as a tool for providing more data and resources to clients efficiently and effectively, thereby maximizing the value delivered by our agents.
  • Consumer Education: Educating consumers about the value of experienced, full-time agents to ensure better service quality and market efficiency.
    • This is a crucial area for me. For over 14 years, I’ve been actively writing articles and sharing insights on St Louis Real Estate News, aiming to educate both consumers and agents. An informed consumer base leads to better decisions, rewarding high-quality, professional agents.

In conclusion, the CFA’s report “A Surfeit of Real Estate Agents: Industry and Consumer Impacts” illuminates significant challenges in today’s market, particularly the glut of agents. At MORE, REALTORS®, we’ve been proactive in addressing these issues through continuous professional development, technological advancement, and consumer education. Our approach isn’t just about adapting to current trends; it’s about setting a higher standard in real estate service. As we navigate these industry changes, our commitment to excellence and informed service remains our guiding principle, ensuring we continue to deliver unmatched value to our clients in St. Louis.


A Surfeit of Real Estate Agents: Industry and Consumer Impacts

(click on image below to view entire report)

A Surfeit of Real Estate Agents: Industry and Consumer Impacts

St Louis Metro Area Real Estate Market Report for December 2023 with accurate data you can trust

The St. Louis Metro Area Real Estate Market Report for December 2023, presented below, provides an overview of the St Louis real estate market for each county within the St Louis MSA. This infographic is a unique offering from “MORE, REALTORS, which is renowned for its expertise in St. Louis real estate market intelligence. Additionally, our brokerage prides itself on having a team of the most experienced and knowledgeable agents who are deeply committed to serving our clients throughout the St. Louis metro area


St Louis Metro Real Estate Report for December 2023

(click on infographic for complete report including all counties in the St Louis Metro Area)St Louis Metro Real Estate Report for December 2023

St. Louis Foreclosure Filings Plummet: Find Out What’s Happening in Your County

The St. Louis MSA has seen a notable decrease in foreclosure filings in the fourth quarter of 2023, with the numbers falling to 851, a 19% reduction from the previous quarter. When we look at the year-over-year data, the decline is even more significant, showing a 46% drop from the fourth quarter of 2022. This downward trend suggests a potentially stabilizing real estate market in the St Louis metro area, with fewer properties entering foreclosure.

Within this broader picture, certain counties have experienced remarkable changes. Monroe County, for instance, recorded a sharp increase of 60% in foreclosure filings from Q3, while Madison County saw filings decrease by 7% in the same period. Saint Clair County, which had faced a high volume of foreclosures, saw a 13% decrease from Q3 2023 and a substantial 79% drop from Q4 2022, reflecting a positive shift for homeowners in the area. This data, encapsulated in the accompanying table, offers a snapshot of the current market conditions and emerging trends in the St. Louis housing landscape.


St Louis Metro Area Foreclosure Filings – 4th Quarter 2023

St Louis Metro Area Foreclosure Filings - 4th Quater 2023

© 2024 St Louis Real Estate News – Data Source:  Attom Data Research

Is the REALTORS’ Clear Cooperation Policy Aiding Market Fairness or Fueling Legal Battles?

Recently, the real estate industry has found itself under increasing legal scrutiny, with multiple lawsuits challenging established norms. A critical point of debate is the REALTORS’ Clear Cooperation Policy. This policy mandates that within one business day of marketing a property to the public, agents must list the property on the MLS. While designed to promote transparency and cooperation among real estate professionals, it’s worth asking: Is this policy partly to blame for the industry’s legal challenges, or does it genuinely foster a fair and open market in compliance with the Sherman Antitrust Act?

The Sherman Antitrust Act, a cornerstone of U.S. antitrust law, prohibits any contract or combination that restrains trade. The Clear Cooperation Policy, by restricting agents’ freedom to market properties outside the MLS, potentially limits competition. Centralizing all listings within the MLS could be seen as creating a monopolistic environment, contrary to the principles of free trade the Sherman Act seeks to protect. On the other hand, proponents argue that the policy ensures equal access to property listings for all agents, thereby benefiting consumers by offering a comprehensive market view.

As legal battles unfold and regulatory bodies like the DOJ and FTC weigh in, the real estate industry awaits clarity. The coming months are crucial, and they will likely reveal whether the Clear Cooperation Policy aligns with the ethos of the Sherman Antitrust Act or contradicts it. As we navigate these complex legal waters, stay tuned to St Louis Real Estate News for the latest developments and insights. We’re committed to keeping you informed about how these critical issues will shape the future of real estate marketing and market fairness. Moreover, you can rely on the professional agents at MORE, REALTORS. They possess not only the knowledge and expertise to navigate through all the rules and regulations but also deliver exceptional results to their clients.


Highlights of the Clear Cooperation Policy

  • Mandatory MLS Listing: Properties must be listed on the MLS within one business day of public marketing.
  • Scope of Public Marketing: Includes flyers, yard signs, digital marketing, and more.
  • Office Exclusive Listings: Allows keeping listings off the MLS if not publicly marketed.
  • Filing Requirement: All exclusive listings must be filed with the MLS if publicly marketed.
  • Enforcement: Imposes fines and reporting mechanism for non-compliance.

Key Components of Sherman Antitrust Act Relevant to the Policy

  • Restriction on Trade: Prohibits practices that restrain trade or commerce.
  • Legal Consequences: Includes fines and imprisonment for violations.
  • Focus on Competition: Aims to maintain free and competitive markets.
  • Application to Real Estate: Includes practices affecting inter-state commerce.
  • Interpretation in Courts: Requires judicial determination on trade restraints.

NAR Aims to Dismiss Moehrl Suit: Summary Judgment Motion Marks Latest Turn in Landmark Real Estate Case

Earlier this week, on Tuesday, December 19, 2023, the Moehrl v. National Association of Realtors (NAR) lawsuit saw a flurry of activity.  Motions for summary judgment were filed by the remaining defendants, including the National Association of REALTORS® (NAR), Keller Williams Realty, Inc., BHH Affiliates, LLC, The Long & Foster Companies, Inc., HSF Affiliates, LLC and HomeServices of America, Inc. Notably, two other defendants, Realogy (now known as Anywhere) and Re/Max, had previously reached a settlement agreement with the plaintiff, which is currently pending court approval.

With the exception of Keller Williams Realty, Inc., all of the real estate brokerage defendants jointly filed a single motion for summary judgment. In contrast, Keller Williams Realty, Inc. submitted their own separate motion, which, while distinct, shares similarities with the collective motion of the other brokerages in its arguments and legal stance.

  • The National Association of Realtors defended its model rules and policies, asserting they’re not conspiratorial and are instead standard practice in the industry, aiming to facilitate transparency and efficiency in real estate transactions.
  • Keller Williams Realty, Inc. focused on their lack of involvement in the alleged conspiracy, emphasizing no direct role in NAR’s Cooperative Compensation Rule.
  • BHH Affiliates, LLC, The Long & Foster Companies, Inc., HSF Affiliates, LLC, HomeServices of America, Inc. similarly argued for their non-participation in any actions related to the NAR rule they’re accused of conspiring to adopt.

As I’ve mentioned in many previous articles, this legal battle, along with other similar cases across the country, is poised to have significant implications for the real estate industry and profession. At the heart of these challenges lies a foundational method of conducting residential real estate transactions, including the compensation of agents (particularly buyer’s agents). Regardless of the outcomes of these lawsuits, the industry is set to undergo significant changes. This is partly due to the heightened attention these cases have attracted, which will likely lead to a better understanding of the transaction process by home buyers and sellers, as well as greater transparency, especially in terms of the roles and compensation of real estate agents involved. Personally, I believe these developments are positive. They will benefit dedicated, professional agents and their clients, and may disadvantage those who are underperforming or, frankly, should not be in the business in the first place.

Find complete information on this lawsuit as well as all the other related lawsuits as well as a wealth of information on the St Louis real estate market at the MORE Resource Center by clicking this link or the button below.


St Louis Metro Area Real Estate Market Report for November 2023 with accurate data you can trust

The St. Louis Metro Area Real Estate Market Report for November 2023, presented below, provides an overview of the November 2023 St Louis real estate market for each county within the St Louis MSA. This infographic is a unique offering from MORE, REALTORS, which is renowned for its expertise in St. Louis real estate market intelligence. Additionally, our brokerage prides itself on having a team of the most experienced and knowledgeable agents who are deeply committed to serving our clients throughout the St. Louis metro area


St Louis MSA Real Estate Report for November 2023

(click on infographic for complete report including all counties in the St Louis Metro Area)St Louis MSA Real Estate Report for November 2023

Indications Lean Towards DOJ in NAR Legal Battle: Insights from Appellate Court’s Oral Arguments

In yet another pivotal moment for the real estate industry, oral arguments were made yesterday before a three-judge panel at the United States Court of Appeals for the District of Columbia Circuit in the ongoing battle between the National Association of REALTORS (NAR) and the Department of Justice (DOJ).   The panel, consisting of Circuit Judges Henderson, Walker, and Pan, will now deliberate and make a ruling in the future, a decision that could significantly impact the industry.

The case centers on NAR’s attempt to prevent the DOJ from reopening an investigation into the organization’s commission-sharing policies. The dispute revolves around a 2020 closure agreement, which NAR interprets as barring any future investigations. However, this interpretation faced scrutiny from the judges, particularly Judge Florence Pan, who questioned the permanence of the agreement.

Representing the DOJ, Frederick Liu argued that there was never an intention to indefinitely halt the investigation. He emphasized that during the negotiation process, the DOJ’s antitrust division did not make explicit commitments to end the probe permanently.

This legal showdown is crucial for NAR, an association with more than 1.5 million members. Just last month, NAR, along with other defendants, lost a nearly $1.8 Billion anti-trust lawsuit here in Missouri (Sitzer v NAR) and NAR is currently facing multiple other antitrust lawsuits, including a substantial class-action suit in Illinois, potentially leading to damages of $40 billion.

NAR’s attorney, Christopher Michel, stressed the significance of the closure agreement, arguing that reopening the investigation would render it meaningless. Judge Justin Walker, however, highlighted the inherent risk NAR took in depending on the continuity of the DOJ’s personnel after the election.

The decision by this appellate court will be closely watched, as it could herald significant changes in how real estate transactions are conducted, affecting agents, buyers, and sellers alike. Stay updated with St Louis Real Estate News for the latest on this critical legal development.


St Louis Real Estate Market Report for October 2023 with accurate data you can trust

The St. Louis Real Estate Market Report for October 2023, presented below, merges data from both the City and County of St. Louis. This infographic is a unique offering from MORE, REALTORS, which is renowned for its expertise in St. Louis real estate market intelligence. Additionally, our brokerage prides itself on having a team of the most experienced and knowledgeable agents who are deeply committed to serving our clients throughout the St. Louis metro area

We invite you to dive deeper into our comprehensive demographic, which also sheds light on the St Charles, Jefferson and Franklin County markets as well by tapping on the image below.


St Louis Real Estate Report for October 2023

(click on infographic for complete report including other counties)St Louis Real Estate Report for October 2023

St Louis Real Estate Market Report for September 2023 with accurate data you can trust

The St. Louis Real Estate Market Report for September 2023, presented below, merges data from both the City and County of St. Louis. This infographic is a unique offering from MORE, REALTORS, which is renowned for its expertise in St. Louis real estate market intelligence. Additionally, our brokerage prides itself on having a team of the most experienced and knowledgeable agents who are deeply committed to serving our clients throughout the St. Louis metro area

We invite you to dive deeper into our comprehensive demographic, which also sheds light on the St Charles, Jefferson and Franklin County markets as well by tapping on the image below.


St Louis Real Estate Report for September 2023

(click on infographic for complete report including other counties)St Louis Real Estate Report for September 2023

St. Louis Housing Market Trends: Navigating the Shift in Supply and Pricing

The St. Louis housing market is undergoing some noteworthy changes, according to the latest data from MORE, REALTORS®. As of today, the supply of homes for sale in St. Louis stands at 1.43 months, a slight uptick from the 1.38-month supply reported at the end of September and the highest level in over 3 years. Additionally, the median price has settled at $260,000, and nearly half (48%) of the active listings have reduced their asking price from their original figures.

A Closer Look at Pricing Trends
Two additional reports from MORE, REALTORS® offer a nuanced view of the market’s pricing dynamics:

  • October 2, 2023 Report: Homes sold during the 30-day period ending on October 2nd had a median price of $285,000 or $191 per square foot.
  • October 27, 2023 Report: Homes sold from October 3rd through October 27th had a median price of $270,000 or $185 per square foot.

These reports indicate a slight softening in home prices, which could be attributed to various factors, including seasonality.

Seasonal Impact on the Market
As we transition from fall into winter, it’s essential to acknowledge the seasonal effects on home sales and prices. Historically, the colder months tend to see a slowdown in market activity, which could explain the recent changes in pricing and supply.


St Louis Real Estate Market Report for August 2023 with accurate data you can trust

The St Louis Real Estate Market Report for August 2023 is below and combines data for the City and County of St Louis.  This data is presented by MORE, REALTORS, recognized as a leading authority in St Louis real estate market intelligence.  We invite you to dive deeper into our comprehensive demographic, which also sheds light on the St Charles, Jefferson and Franklin County markets as well by tapping on the image below.

Navigating the St Louis property landscape requires precision…

In the current property climate, likened to a complex chess match, the price for ill-informed decisions can be high. A limited inventory of homes coupled with a surge of enthusiastic buyers has intensified competition, sometimes leading to overvaluation of properties. While there’s no harm in paying a premium for a home, it’s essential that this decision is backed by concrete data and the right motivations.

Smart decision-making hinges on reliable data and a knowledgeable real estate professional to interpret it. At MORE, REALTORS our pride lies in our team’s expertise to steer both buyers and sellers through the intricacies of the current market with confidence.

Our commitment is to curate and disseminate prime market intelligence, empowering our agents and clientele to make enlightened choices. While no data set is infallible, striving for excellence ensures that our decisions are grounded.

Isn’t this data accessible to all REALTORS¬Æ?

It’s a common assumption that every agent, particularly those that are REALTORS possesses identical data. Taking St. Louis as a case in point, all REALTORS¬Æ can tap into the extensive MARIS MLS system. ¬†However, mere access doesn’t cut it. Think of it as the web: the real test lies in sifting out credible information.

Many agents rely on generic data handed down to them. In contrast, our agents utilize advanced software to tailor-make reports for individual clients. They also meticulously vet the data for discrepancies, emphasizing our commitment to ensuring that you receive nothing but the most reliable insights, even when sourced from a reputable origin like ours.”

Continue reading “St Louis Real Estate Market Report for August 2023 with accurate data you can trust

St Louis Real Estate Market Report for July 2023 with accurate data you can trust

Below is the St Louis Real Estate Market Report for July 2023 for the City and County of St Louis combined from MORE, REALTORS®, one of the most trusted sources for St Louis real estate market data and information.  You can access the full infographic, containing data for St Charles, Jefferson and Franklin Counties as well by clicking on the image below.

The current St Louis real estate market leaves little room for errors…

The real estate market today is like a tough game where making wrong decisions based on poor information can cost you. With few homes listed and many eager buyers, there’s a rush to outbid others, leading some people to pay more than a home’s true value. It’s okay to pay a bit extra if you’re doing it for the right reasons and based on solid facts.

To make smart choices, you need accurate information and a great real estate agent who knows how to use it. I’m proud that our team at MORE, REALTORS® is comprised of such experts who can guide buyers and sellers to make rewarding decisions in this tricky market.

We work hard to gather and share the best market information to help our agents and clients make informed decisions. While no information is 100% perfect, getting as close to that as possible can help you make smarter choices.

Don’t all REALTORS® have this data?

You might think all agents have the same information, especially those under the REALTORS® banner. In St. Louis, for example, every REALTOR® can access the same vast data through the MARIS MLS system. But simply having access isn’t enough. It’s like the internet: the challenge is finding trustworthy information.

A lot of agents use general data given to them by others. Our agents, however, use special software to customize reports for their clients. They also double-check the information to spot any errors. This shows how serious they are about making sure you get only the best, even when the data comes from a trusted source like ours.

Continue reading “St Louis Real Estate Market Report for July 2023 with accurate data you can trust

St Louis Real Estate Market Report for June 2023 with accurate data you can trust

Below is the St Louis Real Estate Market Report for June 2023 for the City and County of St Louis combined from St Louis Real Estate Search (the Official site).    You can access the full infographic, containing data for St Charles, Jefferson and Franklin Counties as well by clicking on the image below.

In the relentless tug-of-war that characterizes today’s real estate market, it’s imperative not to base your choices on misguided data!

The present property market leaves little room for errors, thanks to a deficit of listings and aggressive buyer interest. A combination of these factors has sparked not just bidding contests, but “conditions wars”, making the process exceedingly tough for many. To outshine the competition, buyers often eliminate contingencies from their bids and stretch their financial limits. Frequently, they’re ready to pay a premium beyond the property’s actual worth. As I elaborated in an earlier article, “Are Today’s Homebuyers Exorbitantly Overpaying and Setting Themselves Up for Regret?“, this strategy can be valid, as long as it’s backed by well-informed reasoning.

In order to make such informed decisions, one needs reliable data and a seasoned, professional real estate agent capable of dissecting that data and tailoring it to your specific circumstances. This is what makes me incredibly proud of our team at MORE, REALTORS®. Our representatives are experienced professionals adept at steering both buyers and sellers towards a rewarding outcome amidst the complex dynamics of the current market.

To assist our representatives and clientele, I devote substantial time to accumulating, examining, and disseminating market intelligence and data. My goal is to offer the most exact data possible, enabling shrewd, educated decision-making. Although no data set can claim absolute precision, inching as close to perfection as we can substantially boosts the probability of making prudent decisions.

Doesn’t every agent have the same data at their disposal?

It’s a reasonable assumption that all agents, particularly those affiliated with REALTORS®, can access the same information. In our region, every REALTOR® can indeed tap into the broadest and most detailed reservoir of data for the St. Louis residential real estate market — MARIS, the REALTOR® Multiple Listing System (MLS). However, merely gaining entry to this database is just the initial step. It’s similar to the internet: although nearly any data you desire is available online, the real test is in knowing where to look and identifying the most credible sources. This same notion applies to the property market data present in the MLS.

While most agents aren’t data enthusiasts and usually rely on consolidated data shared by others, our agents, to some degree, follow a similar pattern. Yet, they stand out due to their proficiency in setting parameters and producing bespoke reports for their clients using our exclusive software. Additionally, they don’t merely accept the data we deliver — they scrutinize it, cross-check it, and pinpoint any discrepancies they come across. This degree of dedication, though humbling, reflects their commitment to precision, even when dealing with data from a dependable source like our firm..

Continue reading “St Louis Real Estate Market Report for June 2023 with accurate data you can trust

St Louis Real Estate Market Report for May 2023 with accurate data you can trust

Below is the St Louis Real Estate Market Report for May 2023 for the City and County of St Louis combined from St Louis Real Estate Search (the Official site).    You can access the full infographic, containing data for St Charles, Jefferson and Franklin Counties as well by clicking on the image below.

In this competitive market don’t make decisions based upon bad data!

Today’s real estate market is unforgiving for homebuyers, driven by a scarcity of inventory and robust buyer demand. This, coupled with not just bidding wars but “terms wars”, has made it challenging for many. In an effort to stand out, homebuyers are waiving contingencies from their offers and pushing their budgets to the limit. Quite often, these buyers are willing to pay more than the actual worth of the property. As I previously addressed in my article, “Are Homebuyers Today Grossly Overpaying for Homes and Making Decisions They’ll Regret?“, this approach is acceptable, provided it’s a well-informed decision.

To make such decisions, you need accurate data and an experienced, professional agent who can interpret that data and apply it to your unique situation. This is why I take immense pride in our team at MORE, REALTORS®. Our agents are skilled professionals who can guide both buyers and sellers through the intricacies of the current market to a successful outcome.

To support our agents and clients, I invest considerable time in gathering, scrutinizing, and reporting on market information and data. I aim to provide the most precise data possible to empower smart, informed decision-making. While it’s true that no data can be 100% accurate in all respects, getting as close to that ideal as possible improves the odds of making sound decisions.

Don’t all agents have the same data?  

It’s logical to think that all agents, especially those who are REALTORS®, have access to the same data. Indeed, in our area, all REALTORS® can access the most extensive and comprehensive source of information for the St Louis residential real estate market — MARIS, the REALTOR® Multiple Listing System (MLS). Yet, simply having access to this wealth of information is only the first step. It’s akin to the internet: while you can find nearly any information you seek online, the real challenge lies in knowing where to find it and determining the most accurate sources. The same principle applies to real estate market data available in the MLS.

While most agents aren’t data nerds and often depend on aggregated data provided by others, our agents, to some extent, do the same. However, a notable difference lies in their ability to define criteria and create their own reports for their clients using our proprietary software. Furthermore, they don’t simply accept the data we provide — they scrutinize it, cross-verify it, and highlight any errors they discover. This level of commitment, while humbling, is a testament to their dedication to accuracy, even when the data comes from a trusted source like our company.

Copy and Paste Culture Among Many Agents...

Contrary to the scrutiny that our agents apply to our data, many agents merely copy and paste infographics or reports they receive, without cross-checking the information. Take, for example, the infographic below showing the median sale price of homes in May 2023 for the city and county of St Louis combined as $255,000. Yet, numerous agents are sharing a report that states the median sale price for that market in May was $285,000. That’s nearly 12% higher than the actual figure, a discrepancy I deem significant. If you’re a buyer basing your offer, even partly, on market data, wouldn’t it be better to know the median price is actually $255,000 and not $285,000? Your next question might be, ‘How do you know your data is accurate?’ I’ve discussed this in detail in a previous article, which remains applicable today.”

Continue reading “St Louis Real Estate Market Report for May 2023 with accurate data you can trust

St Louis Real Estate Market Report – April 2023

Below is our St Louis Real Estate Market Report for April 2023 for the City and County of St Louis combined.  You can access the full infographic, containing data for St Charles, Jefferson and Franklin Counties as well by clicking on the image below.

St Louis Real Estate Report for April 2023

(click on infographic for complete report including other counties)St Louis Real Estate Report for April 2023

When will the St Louis real estate market crash?

What strange and confusing times we live in! Some seemingly credible predictions made by qualified experts suggest that our banking system could collapse, our currency may become worthless, and our country may face a significant downturn. Meanwhile, others claim that there is no cause for alarm. Here in St. Louis, the real estate market continues to thrive as if everything is great in our economy, despite the fact that interest rates have doubled in the past year. I have been in this business for 43 years, and although I have seen many ups and downs in the market, I have never seen anything quite like this before. It appears that there is a stark dichotomy between the economy and the St. Louis real estate market at present, as if they are two entirely separate entities. Could this be the result of the low inventory and high demand for housing, leading homeowners to throw caution to the wind? Or is it possible that the St. Louis economy is stronger than the national economy? Whatever the reason may be, despite talk at the national level of a looming housing market crash, the St. Louis real estate market continues to thrive.

Is the St Louis real estate market going to crash?

Now, onto the question of whether the St. Louis real estate market is going to crash. This is a fair question, given the current issues outlined above. However, so far, there are no clear signs of a crash. That’s not to say that there won’t be any changes to the market, as I believe we’ll see some, but nothing that indicates a crash is imminent at this point. Almost a year ago, I wrote an article in which I stated that “I don’t think St. Louis home prices will come crashing down, in fact, I don’t even think they are going to decline necessarily.” This prediction has proven to be accurate. However, I also said in that same article that “I think the premiums buyers have paid over and above the value of the home they were buying are going to quickly come to an end,” and this has proven to be inaccurate.

Despite my prediction, there are still bidding wars happening between buyers on new listings. The STL Market Chart table below shows that last month, the median price of homes sold was equal to 100% of the current list price at the time of sale. Given that the median is indicative of the midpoint of the frequency of values, if the midpoint is 100%, then it appears that plenty of homes are selling in excess of the list price.

The data for the St. Louis real estate market shows that there is a strong buyer demand. In addition, the market is facing the persistent issue of low inventory. These factors have contributed to the resilience of the St. Louis housing market, making it unlikely to succumb to a crash at this point. However, if there is increased economic uncertainty, inflation, and rising interest rates, we may reach a tipping point and see St. Louis home prices decrease. Despite this possibility, it is unlikely to happen anytime soon based on current data.

Continue reading “When will the St Louis real estate market crash?

St Louis Real Estate Market Report

Below is our St Louis Real Estate Market Report for March 2023 for the City and County of St Louis combined.  You can access the full infographic, containing data for St Charles, Jefferson and Franklin Counties as well by clicking on the image below.

St Louis Real Estate Report for March 2023

(click on infographic for complete report including other counties)St Louis Real Estate Report for March 2023

Do the Fed Funds rate and M2 money supply really matter to the St Louis real estate market?

For the past several months there have been many reports anticipating the moves of the Federal Reserve regarding interest rates then followed by tons of articles, blog posts and videos analyzing then predicting the impact of the Fed’s decision on the economy.  The other popular topic in this area is the “Money Supply”, usually M2 money supply and whether it’s increasing or decreasing as well as the impact on the economy.

Should St Louis homeowners and potential home buyers really care about the Fed Funds rate or M2 money supply?

First, let’s talk about the Fed Funds rate and what it is, what it is intended to do and the affect it can have on the real estate market.  The Fed Funds rate is the interest rate at which banks lend to each other overnight to maintain their reserve requirements. This rate is set by the Federal Reserve, and changes to the rate can have a ripple effect throughout the economy, including the mortgage and housing markets. When the Fed lowers the Fed Funds rate, it can stimulate economic growth by making it cheaper for banks to borrow money, which can lead to lower mortgage interest rates. Lower mortgage rates make it more affordable for homebuyers to finance their purchases, which can increase demand for homes and drive up prices. Conversely, when the Fed raises the Fed Funds rate, it can lead to higher mortgage interest rates, which can slow down the housing market and lead to lower demand and prices.

Next, the the M2 money supply.  The M2 money supply includes cash, checking accounts, savings accounts, and other liquid assets that can be easily converted into cash. When the M2 money supply increases, it can stimulate economic activity by making more money available for borrowing and spending. This can lead to lower mortgage interest rates as well, as banks have more funds available to lend out. However, if the M2 money supply increases too rapidly, it can lead to inflation, which can cause mortgage interest rates to rise.

So, as you can see, both the Fed Funds rate and M2 money supply can have a significant impact on the cost of a home mortgage as well as home prices so I would say the answer to the question I posed is “yes”.  Granted, we don’t all need to become economists or stay up late at night pouring through spreadsheets and date, but to be aware of factors that affect the economy as a whole and as a result, the real estate market we’re in, would be wise.

How can knowledge of the Fed Funds rate and M2 money supply help me as a home seller or buyer?

The short answer is, it gives you a little insight into perhaps where things are headed which may help you make the decision to buy or sell sooner or later. For example, perhaps  you are contemplating buying an home but anguishing over the fact the mortgage interest rates are double what they were a year or two ago and you’re thinking maybe you should wait until things settle down.  Well, if you see the Fed Funds rate getting increased with talk of more increases while that is no guarantee mortgage interest rates will increase as well, as I explained above, it’s certainly an indicator that is a likelihood.  Therefore, you may decide it’s better to make a move now than later.

What’s an easy way to track this stuff?

I have the answer for you.  The charts below are two of the many charts and other information available on St Louis Real Estate Search as well as from MORE, REALTORS® .  The first chart shows the relationship historically between St Louis home prices and the M2 Money Supply.  Generally, they follow the same trend but, when the trend for one changes, like it did with St Louis home prices (the red line on the chart) beginning in the late 90’s through the housing market bubble burst after 2006, something happens to bring them back in line.  As you can see, starting a little over 3 years ago the pace at which M2 was growing outpaced St Louis home prices, but St Louis home prices quickly caught up. Now it’s the opposite and it looks like both a making a downward correction.

The bottom chart shows the close relationship between the Fed Funds rate and mortgage interest rates.  With little exception, when the Fed Funds rate increases or decreases, mortgage rates follow. For the past year, the Fed Funds rate has increased and the trend is upward so I wouldn’t expect to see falling mortgage interest rates anytime soon.

Continue reading “Do the Fed Funds rate and M2 money supply really matter to the St Louis real estate market?

St Louis Real Estate Market Report

Below is our St Louis Real Estate Market Report for February 2023 for the City and County of St Louis combined.  You can access the full infographic, containing data for St Charles, Jefferson and Franklin Counties as well by clicking on the image below.

St Louis Real Estate Report for February 2023

(click on infographic for complete report including other counties)St Louis Real Estate Report for February 2023

St Louis Foreclosures In November Up Forty-Two percent from a year ago

During November, there were 255 properties with foreclosure filings in the St Louis MSA, according to ATTOM Data’s U.S. Foreclosure Market Report.  This represents an increase of 42% in St Louis foreclosures from November of 2021 but is a decline of over 76% from the prior month, according to the report.

As the chart below shows, 8 counties reported an increase in foreclosures from a year ago, 2 counties had a decrease in foreclosure activity and 5 had no change in activity.  Macoupin County, Illinois saw the largest increase at 367% followed by Warren  County, Missouri at 300%.

[xyz-ips snippet=”Foreclosures-For-Sale-and-Homes-For-Sale”]

St Louis MSA Foreclosure Activity – November 2022 vs November 2021

Data source: ATTOM Data Research – Copyright 2022 St Louis Real Estate News

St Louis Real Estate Market Update – Video

Is the St Louis real estate market going to crash?  The national news is filled lately with reports of slowing housing markets throughout the country, increasing inventories, falling sales and prices.  Some prognosticators are predicting some metro areas will see home prices fall by as much as 40 or 50 percent.  Is the St Louis real estate market on a similar trajectory??  While I can’t predict the future, I can share data to help you see where the St Louis real estate market is currently as well as where the data shows it’s headed.  

[xyz-ips snippet=”Market-Update-Video–Media-Center”]

St Louis Real Estate Market Update - Video

[xyz-ips snippet=”Seller-Resources—Listing-Targeted”]

St Louis Real Estate Market Report For October 2022

Below is our St Louis Real Estate Market Report for October 2022 for the City and County of St Louis combined.  You can access the full infographic, containing data for St Charles, Jefferson and Franklin Counties as well by clicking on the image below.

St Louis Real Estate Report for October 2022

(click on infographic for complete report including other counties)St Louis Real Estate Report for October 2022

St Louis Foreclosure Filings During Third Quarter Increase 45 Percent From A Year Ago

During the third quarter of this year, there were 907 properties with foreclosure filings in the St Louis MSA, according to ATTOM Data’s U.S. Foreclosure Market Report.  This represents an increase of 44.43% in St Louis foreclosures from the same quarter a year ago but is a decline of 16% from the second quarter of this year, according to the report.

As the table below shows, with the exception of Bond County in Illinois, all 15 counties reported had an increase in foreclosure activity during the 3rd quarter over last year, and all at least a double-digit increase.   Lincoln County, Missouri saw the largest increase at 325% followed by Macoupin County, Illinois at 293%.    Only five of the 15 counties saw an increase in foreclosure activity from the prior quarter.

Given the inflation numbers announced yesterday, rising interest rates and the rest of the economic challenges that exist we are likely to see a continued increase in foreclosure activity for the foreseeable future.

[xyz-ips snippet=”Foreclosures-For-Sale-and-Homes-For-Sale”]

St Louis MSA Foreclosure Activity – 3rd Quarter 2022

St Louis MSA Foreclosure Activity - 3rd Quarter 2022

Data source: ATTOM Data Research – Copyright 2022 St Louis Real Estate News

St Louis Real Estate Market Report For September 2022

Below is our St Louis Real Estate Market Report for September 2022 for the City and County of St Louis combined.  You can access the full infographic, containing data for St Charles, Jefferson and Franklin Counties as well by clicking on the image below.  Worth noting and remembering is not all data is created equally nor is all of what you see reported accurate.  Given the challenging and rapidly changing economic times we are in which are having an direct impact on the St Louis housing and real estate market, now, almost more than ever, you need to be sure the data you base your real estate decisions on is accurate and the agents you are trusting to get you through the process have the knowledge, information and accurate data they need to do so.  At MORE, REALTORS® we have developed proprietary software which uses the database we have created from the REALTOR® MLS (MARIS) to produce what we believe is the most accurate and relevant data and reports for the St Louis residential real estate market.  For example, currently, there are other sources reporting (and many, many real estate agents sharing the information without verifying) that the median price for homes sold in the City and County of St Louis during September was over 6% higher than our data shown below.  Think what an impact that could have on you if you base your decision to buy or sell a home on pricing data that is over stating the value.

Oh, how do we know we’re right?  We have proof, straight from the MLS, see the image below our infographic which is a screen shot straight from the MLS showing date for closed sales during the month of September in the city and county of St Louis.  You’ll find that the median price from the MLS is $250,000, the same as our data computed, the number of sales is a little higher in the MLS (20 or just over 1%) because while about 99% of sales are sent out in “feeds” to broker websites etc (including Zillow and Realtor.com) there are a few listings that are not and the DOM (days on market, or days to sell) at 10 is very close to our 12 (this is due to us using a slightly different method to compute median for the data).

St Louis Real Estate Report for September 2022

(click on infographic for complete report including other counties)
Continue reading “St Louis Real Estate Market Report For September 2022

Why St Louis Home Prices Are Going To Decline

A little over two weeks ago I wrote my most recent article addressing St Louis home prices titled “Will St Louis Home Prices Decline?” in which my short answer was “yes”, but kind of tongue in cheek and based upon the seasonality of home prices, but my longer answer was more vague.  I mentioned that there certainly is a correction coming but pointed out that there are so many variables that will affect prices that it is hard to say to what extent this correction will be.  While this is still true, a lot has happened in the short time period since that article that has caused me to become more bearish on the St Louis real estate market to the point where I’m confident St Louis home prices will decline.

What has changed in the last 16 days…

  • While it doesn’t directly impact the St Louis market, hurricane Ian has wreaked havoc on a lot of Florida and other areas and will no doubt impact the overall housing market and economy and likely in more of a negative way.
  • Interest rates have risen another 1/2% hitting and staying near 7%.
  • The Mortgage Bankers Association (MBA) just announced that mortgage applications dropped over 14% during the last week of September, the biggest one-week drop in 17 months and pushed their index down to the lowest point since 1997.
  • The percentage of active listings that have reduced the asking price at least once broke the 40% mark.
  • The 12-month home sales trend for St Louis for the period ending September 30, 2022 fell to the lowest point in over 2-years.
  • Active listings in St Louis have been for sale a median of 43 days over four times higher than the median time to sell during the past 2 years of 10 days.

Market data pointing to lower St Louis home prices…

  • The declining sales trend mentioned above.  As chart 1 below shows, home sales during September in St Louis were down nearly 19% from last September.
  • The declining home price trend.  Chart 1 also reveals the median price of homes sold during September 2022 was $267,500, only 2.8% from then September 2021 when the median sold price was $260,000 which was a 8.3% increase from September 2020 when the median price was $240,000.
  • Showings on active listings continues to decline.  Chart 2 shows there are almost 10% fewer showings of active listings now then there were in the first week of January (the slowest time of the year).  Last year at this time showing activity was over 30% higher than now and in 2020 it was abut 55% higher.  Fewer showings mean fewer sales in coming.
  • The widening gap between home prices and rental rates.  Chart 3 shows the home price index (blue line) rising above the rental rates (red line) at a fairly steep rate. Historically, such as the late 1980’s – 2000 shown on the left side of the chart, these two lines track closely with home prices slight below the rental rates line.  The last time home prices started increasing more than rents was in the early 2000’s and this continue until the gap widened to the point that something had to give…either home prices had to fall or rents had to increase.  In 2008, the bubble burst and home prices fell.  While the present gap is not as large as it was during the height of the housing market bubble in 2006-07, we’re headed that way.
  • CPI and St Louis Home Price Index are hitting bubble levels.  Chart 4 shows the rate of change (year over year) in CPI and the  St Louis home price index.  The rate of change in both has already exceeded what in the past (with the exception of 1979 when it went a little higher) has triggered home prices to fall.
  • Home price and interest rate increases are killing St Lous home affordability.  Table 5 shows that currently, based upon median home prices and interest rates, one year of house payments (principal and interest only) take about 30% of the median household income for St Louis.  In 2007, at the peak of the housing bubble, it was only 21% and in 2000, which many economists use as a “normal” or baseline year, it was 20%.  So the real cost of a typical St Louis home to a typical St Louis family is about 50% higher now than normal.

Continue reading “Why St Louis Home Prices Are Going To Decline

Will The Housing Market Crash?

Apparently a lot of consumers are concerned about the housing market crashing or at least concerned enough to be online searching for answers.  According to Google Trends the search phrase “Will The Housing Market Crash?” has hit it’s 5-year peak in terms of interest level during the last 4-5 months.  In addition, according to Google Adwords tools, there are 10,000 – 100,000 searches for month for the phrase “Will The Housing Market Crash?” and 100,000 – 1,000, 000 monthly searches for “housing market crash“.

Will there actually be a housing market crash in St Louis?

I guess first we should define “crash” as the word itself sounds rather harsh.  But if we agree that a market crash would be less severe than the housing market bubble burst we witnessed in 2008, then I would say a “crash” is more likely than a bubble burst.  However, what may seem like a crash in the St Louis housing market may in fact not be as much of a crash as well as a correction.  Given that the St Louis real estate market has been flying high for a few years now and many seller’s have felt like they died and went to heaven and buyer’s just felt like they died from the competition and difficulty in buying a home, a correction is really needed.

How bad will the St Louis housing market correction be?

Continue reading “Will The Housing Market Crash?

St Louis Area Housing Market Report For June 2022

St Louis Real Estate Report for June 2022

(click on infographic for complete report including other counties)St Louis Housing Report for June 2022 - St Louis Realtors

Nearly One-Third Of St Louis Homes Listed For Sale Have Reduced The Price

Price reductions are quickly showing up more and more on real estate listings in the St Louis area.  As the Infograph below illustrates, 31% of the current active listings in St Louis have had at least one price reduction.  Since the price homes sell at isn’t known until closing and a home sale typically takes 4 to 6 weeks to close, the actual sold prices won’t reflect these price reductions for a while.  For example, in the past 30 days (through today) there have been 2,381 closings of home sales in the 5-county St Louis core market at a median price of 104% of the original list price.  In about a month we’ll revisit that stat and see how things look.

Continue reading “Nearly One-Third Of St Louis Homes Listed For Sale Have Reduced The Price