The St. Louis real estate market is a complex landscape, influenced by various factors such as location, amenities, and notably, school districts. In this article, we delve into an exclusive comparison between two St Louis school districts: Rockwood in west St Louis county and Ferguson-Florissant in north St Louis county. Utilizing the STL Market Reports provided exclusively by MORE, REALTORS®, as well as infographics depicting census data, we aim to offer a comprehensive overview of these markets for the 12-month period ending September 30, 2023.
Key Market Trends
Rockwood School District
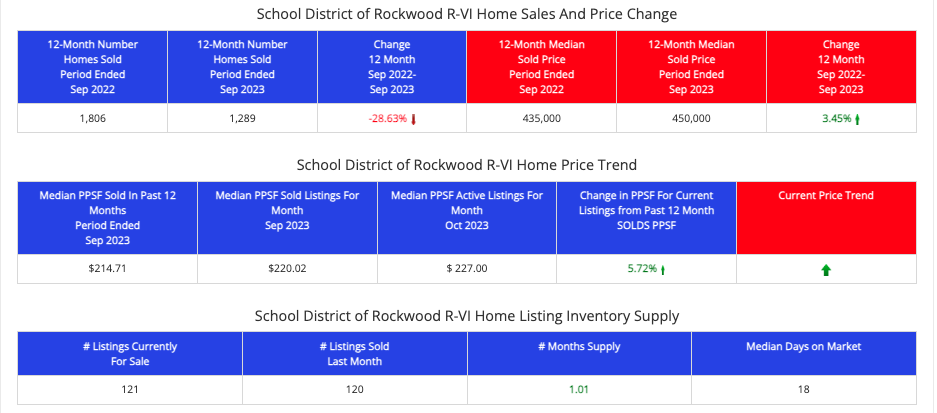
- Decline in Sales: The Rockwood School District saw a decline of 28.63% in the number of homes sold compared to the prior 12-month period.
- Increase in Price: Despite the decline in sales, the median sold price increased by 3.45%.
Ferguson-Florissant School District
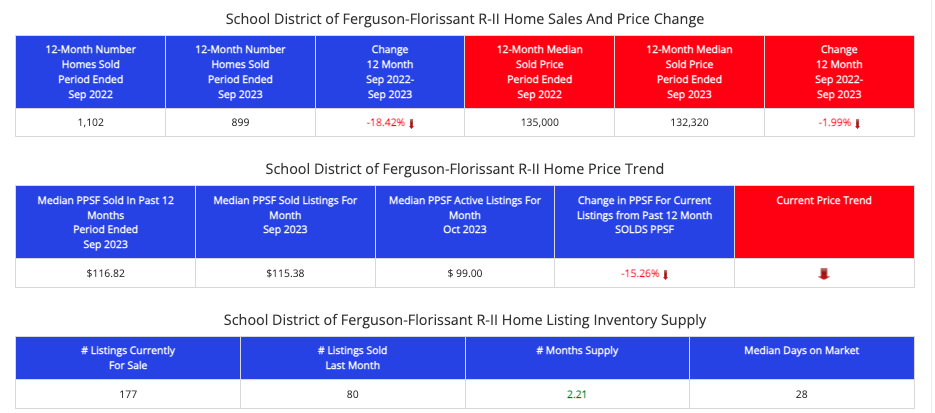
- Decline in Sales: The Ferguson-Florissant School District experienced a decline in sales of 18.42%.
- Decrease in Price: Unlike Rockwood, Ferguson-Florissant also saw a decline in the median sold price by 1.99%.
Census Data Insights
Rockwood School District
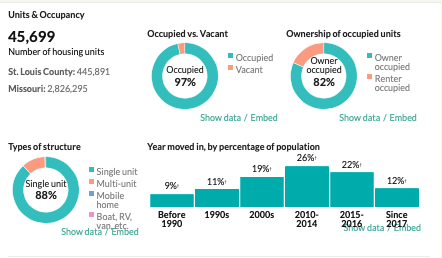
- Housing Occupancy: 97% of housing units are occupied.
- Type of Housing: 88% of these are single-family homes.
- Ownership: A significant 82% are owner-occupied.
Ferguson-Florissant School District
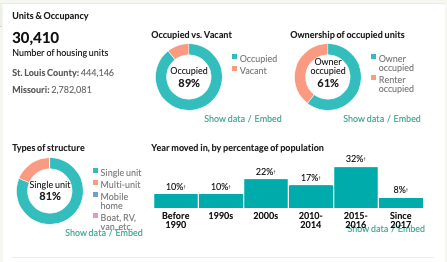
- Housing Occupancy: 89% of housing units are occupied.
- Type of Housing: 81% are single-family homes.
- Ownership: Only 61% are owner-occupied.
Rockwood School District – Real Estate Market
(click on table for updated report)
Ferguson-Florissant School District – Real Estate Market
(click on table for updated report)
Connecting the Dots: Ownership vs. Market Trends
One of the most striking differences between the two districts is the rate of owner-occupied homes. Rockwood, with an 82% owner-occupancy rate, saw an increase in median home prices despite a decline in sales. This could suggest that the stability and demand generated by a high percentage of owner-occupied homes can sustain or even increase property values, even when sales volume decreases.
On the other hand, Ferguson-Florissant, with a lower owner-occupancy rate of 61%, experienced declines in both sales and prices. Lower rates of owner-occupancy can sometimes be associated with less neighborhood stability and lower demand, factors that could contribute to declining sales and prices.
Ferguson-Florissant School District Census Data

Rockwood School District Census Data

For the most accurate and up-to-date information on St. Louis real estate, rely on STL Market Reports and other resources provided exclusively by MORE, REALTORS®.
Comments are closed.


