St Louis New Home Building Permits – February 2024
(click on table below for page with live charts showing additional permit data)
 In the St. Louis real estate market, ‘split closings’—where buyers and sellers close at different title companies—are a common practice. This is in contrast to most parts of the country, where a single title insurance company manages the closing for both parties. Although rare nationally, split closings have become a hallmark of the St. Louis real estate scene.
In a split closing, each title company plays a distinct role. The buyer’s title company is typically responsible for producing the title insurance commitment, ordering buyer-related items (like surveys), and coordinating with the new lender on figures and requirements. Conversely, the seller’s title company takes the commitment from the buyer’s title company and assists the seller in clearing any liens, checking for assessments and specials, and verifying commission and earnest money. Each company then prepares a closing statement for their side, and the two companies reconcile the figures.
Despite being the norm in St. Louis, split closings come with their share of risks and inconveniences. To gain a deeper understanding of these challenges, I consulted Greg Miller, Manager at M&I Title, LLC. He outlined the most common risks and inconveniences stemming from split closings:
Risks and Inconveniences of Split Closings
- Potential Miscommunication: The division of responsibilities between two title companies can result in crucial information getting lost or misinterpreted. For example, discrepancies in settlement figures or misunderstanding regarding the readiness of documents can cause significant delays.
- Difficulty in Resolving Issues: On the day of closing, last-minute hurdles such as undiscovered liens, discrepancies in documents, or issues arising from the final walkthrough can be more cumbersome. Each title company may have different procedures for handling these issues, complicating coordination and resolution efforts.
- Delayed Seller Proceeds: For sellers, this delay means that the proceeds from the sale may not be available on the day of closing. This is particularly problematic for sellers who are relying on these funds to purchase another home simultaneously. The absence of timely proceeds can disrupt the entire chain of transactions, potentially leading to breaches of contract or the need for temporary, and often costly, financial arrangements.
- Buyer Possession Issues: Buyers, on the other hand, may face delays in gaining possession of their new home. Since a real estate transaction is not considered closed until it is fully funded and the deed has been delivered to the buyer, any delay in these processes means the buyer technically does not own the home. This could result in the buyer being unable to move into their new home as planned, leading to additional costs or complications, especially if they have already vacated their previous residence.
- Increased Costs: Sellers may face additional fees for closing services, courier charges for document transfers, and possibly higher coordination fees due to the involvement of an additional title company. These costs can vary widely and may also impact buyers if contractually passed on.
- Wire Fraud Vulnerability: The exchange of sensitive financial information between multiple parties increases the risk of interception by cybercriminals. The complexity of communication can make it easier for fraudulent wire transfer instructions to go unnoticed until too late.
Additional Considerations
- Privacy Concerns: With two title companies involved, sensitive personal and financial information is shared more broadly, increasing the risk of data breaches or unauthorized access.
- Complex Coordination for Agents and Lenders: Real estate agents and lenders must navigate communication between two companies, adding complexity to their roles and potentially straining relationships with clients due to unforeseen delays or issues.
- Risk of Non-Compliance: Each title company may interpret regulatory requirements slightly differently. This divergence can lead to compliance issues, affecting the legality of the closing process and potentially exposing all parties to legal risks.
- Customer Service Variability: With two companies involved, the level of customer service can vary, potentially leading to a disjointed experience for both buyer and seller. Inconsistent communication or service levels can increase stress and dissatisfaction with the process.
By understanding these expanded issues and additional considerations, professionals and clients in the St. Louis real estate market can better prepare for the complexities of split closings. Strategies such as enhanced communication protocols, clearer contractual agreements regarding responsibilities and fees, and increased vigilance against fraud can mitigate some of these challenges.
In the 12-month period ended January 31, 2024 the St. Louis area saw the issuance of 3,996 building permits for new single-family homes. This represents a decline of 3.64% compared to the previous 12-month period, which had 4,147 permits, according to the latest figures from the Home Builders Association of St. Louis & Eastern Missouri (St. Louis HBA). This downward trend was noted across all counties with the exception of St. Charles County, with two counties reporting double-digit decreases.
St Louis New Home Building Permits – January 2024
(click on table below for page with live charts showing additional permit data)
The dynamics of the new home market are shifting significantly as we advance into 2024, with a clear trend towards smaller, more personalized living spaces emerging nationwide. This evolution reflects a broader change in homeowner preferences and market conditions, according to the latest “What Home Buyers Really Want” study by the National Association of Home Builders (NAHB).
Recent data points to a decline in the average size of new homes, continuing a trend that began following a brief uptick in 2021. The average new home size has decreased to 2,411 square feet in 2023, marking the smallest average size in over a decade. This reduction aligns with homebuyers’ preferences, which have also shifted towards more compact living spaces. Today, the desired home size is around 2,070 square feet, significantly less than the 2,260 square feet preferred two decades ago.
Rose Quint, NAHB’s assistant vice president of survey research, identifies two main factors driving this trend: a change in homebuyer preferences and the escalating challenge of housing affordability. In response, builders are adapting their strategies, with 38% reporting a shift towards constructing smaller homes in 2023 to facilitate sales, and 26% planning to continue this approach into 2024. Efforts to address affordability concerns have led to reductions in median new home prices to $427,400 in 2023, a 7 percentage point drop from the previous year and the most significant decrease since 2009.
Beyond size, homebuyers are increasingly seeking personalized and authentic living spaces. Donald Ruthroff, AIA, of Design Story Spaces LLC, highlights a growing demand for customization, with homeowners desiring unique features that set their homes apart. This trend towards personalization is evident in the choice of home upgrades, from custom kitchen islands to premium flooring options.
The study also reveals that homebuyers’ priorities have evolved, with a focus on outdoor living, kitchen functionality, and energy efficiency. Top desired features include laundry rooms, patios, Energy Star windows, and smart home technology, such as security cameras and programmable thermostats. Additionally, preferences have expanded to include quartz countertops, outdoor kitchens, and built-in seating, underscoring a shift towards both practicality and luxury in home design.
As we move through 2024, the shift towards smaller, more personalized homes is reshaping the real estate landscape. This trend, driven by changing preferences and affordability challenges, highlights the importance of staying informed about market dynamics for both homebuyers and builders and you’re in the right place now to do that, St Louis Real Estate News.
In 2023, the St. Louis area saw the issuance of 3,891 building permits for new single-family homes. This represents a decline of 10.78% compared to the previous year, which had 4,361 permits, according to the latest figures from the Home Builders Association of St. Louis & Eastern Missouri (St. Louis HBA). This downward trend was noted across all counties with the exception of St. Charles County, where five counties reported double-digit decreases. Additionally, Warren County, which had been on a four-month streak of increased permit activity, experienced a slight drop this month. The total of 3,891 permits in 2023 is the lowest the St. Louis area has seen since 2014, when 3,843 permits were issued. Furthermore, this total is nearly 17% below the 20-year average of 4,680 permits annually and 11% below the 20-year median of 4,375 permits.
St Louis New Home Building Permits – December 2023
(click on table below for page with live charts showing additional permit data)
During the 12-month period ending November 30, 2023, there were 3,932 building permits issued for new single-family homes in the St. Louis area. This figure marks a 14.71% decrease from the previous 12-month period, which saw 4,515 permits issued, as per the latest data from the Home Builders Association of St. Louis & Eastern Missouri (St. Louis HBA). The downturn was observed in all counties except Warren County, with five of them experiencing double-digit declines. Warren County notably reported an increase in building permits for the fourth consecutive month.
St Louis New Home Building Permits – November 2023
(click on table below for page with live charts showing additional permit data)
There were 3,932 building permits issued for new single-family homes in the St Louis area during the 12-month period ended October 31, 2023. This represents a decline of 12.60% from the prior 12-month period, during which 4,499 permits were issued, according to the latest data from the Home Builders Association of St. Louis & Eastern Missouri (St Louis HBA). Five of the seven counties covered in the report saw a decline in building permits from the previous period with 4 of them seeing double digit declines. Warren County, on the other hand, saw a slight increase in permit activity for the third month in a row.
St Louis New Home Building Permits – October 2023
(click on table below for page with live charts showing additional permit data)
There were 3,905 building permits issued for new single-family homes in the St Louis area during the 12-month period ended September 30, 2023. This represents a decline of 13.20% from the prior 12-month period, during which 4,499 permits were issued, according to the latest data from the Home Builders Association of St. Louis & Eastern Missouri (St Louis HBA). Six of the seven counties covered in the report saw a decline in building permits from the previous period with 4 of them seeing double digit declines. Warren County, on the other hand, saw a slight increase in permit activity for the second month in a row.
St Louis New Home Building Permits – September 2023
(click on table below for page with live charts showing additional permit data)
In a remarkable turn of events, just minutes after the jury sided with the homeseller-plaintiffs in the landmark Sitzer | Burnett trial, attorney Michael Ketchmark wasted no time in launching another legal salvo against the real estate industry. This new class action lawsuit, filed on behalf of three new homesellers, aims to further scrutinize the practices surrounding agent commissions.
The Defendants
This new lawsuit expands the list of defendants to include: Compass, eXp World Holdings, Redfin, Weichert Realtors, United Real Estate, Howard Hanna, and Douglas Elliman. Notably, the National Association of Realtors is once again named as a defendant, marking its continued entanglement in legal challenges related to commission structures.
The Allegations
The plaintiffs in this new case echo the grievances aired in the Sitzer | Burnett lawsuit, claiming they have been adversely affected by a “real estate industry conspiracy” that artificially inflates agent commissions. The suit alleges that this practice has a cascading effect, ultimately driving up costs for homesellers.
Legal Venue
The lawsuit has been filed in the United States District Court for the Western District of Missouri, the same jurisdiction that recently saw the Sitzer | Burnett plaintiffs awarded $1.785 billion in damages.
What This Means for the Industry
The filing of this new lawsuit so swiftly on the heels of the Sitzer | Burnett verdict could signal a wave of legal challenges aimed at traditional real estate commission models. Industry stakeholders will undoubtedly be watching closely as this new case unfolds, given its potential to further disrupt established practices and financial structures within the real estate market.
There were 3,946 building permits issued for new single-family homes in the St Louis area during the 12-month period ended August 31, 2023. This represents a decline of 12.04% from the prior 12-month period, during which 4,486 permits were issued, according to the latest data from the Home Builders Association of St. Louis & Eastern Missouri (St Louis HBA). Six of the seven counties covered in the report saw a decline in building permits from the previous period with 4 of them seeing double digit declines. Warren County, on the other hand, saw a slight increase in permit activity.
St Louis New Home Building Permits – August 2023
(click on table below for page with live charts showing additional permit data)
There were 3,950 building permits issued for new single-family homes in the St Louis area during the 12-month period ended July 31, 2023.  This represents a decrease of 13.38% from the prior 12-month period, during which 4,560 permits were issued, according to the latest data from the Home Builders Association of St. Louis & Eastern Missouri (St Louis HBA).   All seven of the counties covered in the report saw a decline in building permits from the previous period.
St Louis New Home Building Permits – July 2023
(click on table below for page with live charts showing additional permit data)
There were 4,017 building permits issued for new single-family homes in the St Louis area during the 12-month period ended June 30, 2023. This represents a decrease of 11.05% from the prior 12-month period, during which 4,516 permits were issued, according to the latest data from the Home Builders Association of St. Louis & Eastern Missouri (St Louis HBA). Six of the seven counties covered in the report saw a decline in building permits from the previous period, with the City of St Louis and Lincoln County experiencing double-digit declines.
St Louis New Home Building Permits – June 2023
(click on table below for page with live charts showing additional permit data)
There were 3,820 building permits issued for new single-family homes in the St Louis area during the 12-month period ended May 31, 2023. This represents a decrease of 17.28% from the prior 12-month period, during which 4,618 permits were issued, according to the latest data from the Home Builders Association of St. Louis & Eastern Missouri (St Louis HBA). All seven counties covered in the report saw a decline in building permits from the previous period, with all but one of them experiencing double-digit declines.
St Louis New Home Building Permits – May 2023
(click on table below for page with live charts showing additional permit data)
There were 3,882 building permits issued for new single-family homes in the St Louis area during the 12-month period ended April 30, 2023. This represents a decrease of 16.34% from the prior 12-month period, during which 4,640 permits were issued, according to the latest data from the Home Builders Association of St. Louis & Eastern Missouri (St Louis HBA). All seven counties covered in the report saw a decline in building permits from the previous period, with all but one of them experiencing double-digit declines. Also worth noting is this month marked the end to Franklin County’s streak of increased building permits over the prior period which lasted 20 months.
St Louis New Home Building Permits – April 2023
(click on table below for page with live charts showing additional permit data)
I’ve been in the real estate business since I was 17, which means it has been 45 years of experiencing various market conditions, including recessions, inflation, 18% mortgage rates, the burst of the housing bubble, and a myriad of other good and bad things. However, I can confidently say that I have never witnessed a real estate market quite like the one we have been experiencing in the past couple of years.
So, what makes the current real estate market so unique?
First and foremost, I’ve pondered this question extensively, and I honestly can’t recall a time in this industry when the supply of homes for sale was not at least 4 to 6 months’ worth. Although there was a brief period in 2015 when the inventory of homes in St. Louis fell below 4 months, it quickly returned to nearly 5 months. From 2016 until early 2020, the inventory fluctuated between approximately 2 and 3 months, and then began a downward trend, hitting a record low of less than a 1-month supply in the latter part of 2021. While the supply has slightly increased since then, it still hovers around 1 month.
Months of Inventory – St Louis 5-County Core – 2013 – 2023
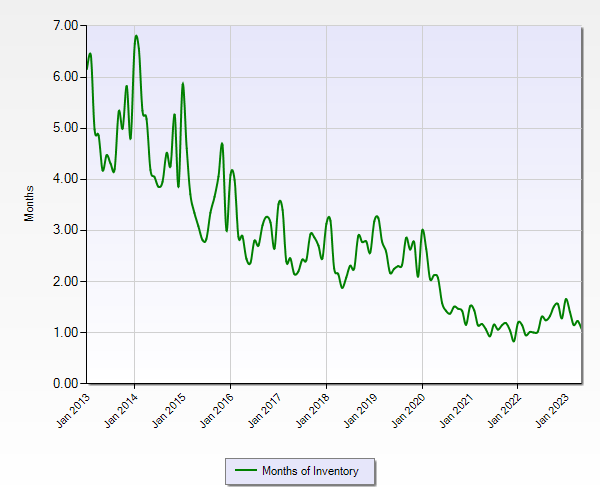
This situation showcases the basic law of economics—supply and demand. The supply of homes for sale in St. Louis is exceptionally low, and even though the number of home buyers in the market has seemingly declined significantly over the past few years, there still isn’t enough supply to meet the demand of the remaining buyers. Consequently, in accordance with the law of supply and demand, prices tend to rise when supply is insufficient to meet demand. While it’s easy to increase widget production to meet demand, it’s not as simple to suddenly add thousands of homes to the market in the St. Louis real estate market. Factors such as a lack of available land for development in high-demand areas, lengthy approval processes for new developments, labor shortages in the trades, difficulty in controlling construction costs, and the significant time required to bring a substantial number of homes to the market contribute to this complexity. As a developer, I can attest that the development process is lengthy enough for the market dynamics to change entirely before the first home hits the market.
So, where did all the houses go in St Louis? Why aren’t there more homes for sale?
There were 3,920 building permits issued for new single-family homes in the St Louis area during the 12-month period ended March 31, 2023. This represents a decrease of 16.58% from the prior 12-month period, during which 4,699 permits were issued, according to the latest data from the Home Builders Association of St. Louis & Eastern Missouri (St Louis HBA). Six of the seven counties covered in the report saw a decline in building permits from the previous period, with five of them experiencing double-digit declines. In contrast, Franklin County saw an increase of over 4%, marking the 20th consecutive month of increases.
St Louis New Home Building Permits – March 2023
(click on table below for page with live charts showing additional permit data)
There were 4,170 building permits issued for new single-family homes in the St Louis area during the 12-month period ended February 28, 2023, a decrease of 10.69% from the same period a year ago when there were 4,669 permits issued, according to the latest data from the Home Builders Association of St. Louis & Eastern Missouri (St Louis HBA). Six of the seven counties covered in the report saw a decline in building permits from the same period a year ago with four of them experiencing double-digit declines. Franklin County, on the other hand, saw an increase of nearly 19%.
St Louis New Home Building Permits – February 2023
(click on table below for page with live charts showing additional permit data)
There were 4,147 building permits issued for new single-family homes in the St Louis area during the 12-month period ended January 31, 2023, a decrease of 13.48% from the same period a year ago when there were 4,793 permits issued, according to the latest data from the Home Builders Association of St. Louis & Eastern Missouri (St Louis HBA). Six of the seven counties covered in the report saw a decline in building permits from the same period a year ago with four of them experiencing double-digit declines.
St Louis New Home Building Permits – January 2023
(click on table below for page with live charts showing additional permit data)
There were 4,361 building permits issued for new single-family homes in the St Louis area during 2022, a decline of 9.62% from 2021 when there were 4,825 permits issued, according to the latest data from the Home Builders Association of St. Louis & Eastern Missouri (St Louis HBA). As the table below shows, 4 of the 7 counties included in the report had a decline in the number of permits issued in 2022 from the year before, with there of them double-digit declines. Lincoln County saw the biggest drop percentage-wise with a decline of 38.27% followed by St Charles County at 21.8%. All of the increases seen in the 3 remaining counties were single-digit increases with Franklin County the highest with an 8.36% increase.
As the chart below the table illustrates, 2022 saw the lowest number of building permits for new homes issued since 2015 when were there 4,200 issued.
Continue reading “St Louis Area New Home Building Permits for 2022 at lowest level in seven years“
There were 4,515 building permits issued for new single-family homes in the St Louis area during the 12-month period ended November 30, 2022, a decrease of 6.93% from the same period a year ago when there were 4,851 permits issued, according to the latest data from the Home Builders Association of St. Louis & Eastern Missouri (St Louis HBA). Four of the seven counties covered in the report saw an increase in building permits from the same period a year ago with the largest increase (9.15%) coming in St Louis County.
St Louis New Home Building Permits – November 2022
(click on table below for page with live charts showing additional permit data)

Even though the number of new home building permits in the St Louis area has been on the decline, they’re been on the increase in the midwest region of which St Louis is a part. As the chart below illustrates, for the 12-month period ended last month, there are been 2,850 building permits issued for new privately-owned housing units in the midwest region of the U.S. an increase of 3.6% from he prior 12-month period when there were 2,746 permits issued. For just the month of November 2022, there were 197 permits, down nearly 8% from November 2021 when 214 permits were issued.
New home construction starts on the rise as well…
Depicted also on the chart below is the number of new homes where construction has actually begun, referred to as “starts”. The number of starts always tends to be lower than the number of permits issued as there are many issues that could arise that would cause a home not to be built even though a permit was issued for it. One of those issues could be the developer or builder’s sentiment about the market which, if trending unfavorably, may cause the developer to postpone adding to inventory. However, even though we saw builder sentiment decline every month this year, the number of new home starts in the midwest region for the most recent 12-month period increased 5% from the prior 12-month period. There were 2,657 new home starts in the 12-month period ended last month compared with 2,523 starts during the prior 12-month period. For just November 2022, there were 215 starts, down just one from November 2021 when there were 216 starts.
Continue reading “New Home Construction In Midwest During Increased During Past 12 Months“
The National Association of Home Builders (NAHB) released their NAHB/Wells Fargo Housing Market Index (HMI) report for December 2022 and, not surprisingly, it shows the builders are continuing to lose confidence in the market. In fact, builder sentiment has dropped every month during 2022, ending the year at an index value of 31, the lowest seen since the onslaught of COVID-19 in April 2020.
NAHB/Wells Fargo Housing Market Index (HMI) / Builder Sentiment Chart
(click on chart for live, interactive chart)
 / Builder Sentiment Chart")
There were 4,499 building permits issued for new single-family homes in the St Louis area during the 12-month period ended October 31, 2022, a decrease of 7.01% from the same period a year ago when there were 4,838 permits issued, according to the latest data from the Home Builders Association of St. Louis & Eastern Missouri (St Louis HBA). Five of the seven counties covered in the report saw a decrease in building permits from the same period a year ago with three of the counties have a double digit decline. Franklin County came out the big winner with nearly a 15% increase in building permits issued during the past 12-months.
St Louis New Home Building Permits – October 2022

There were 4,499 building permits issued for new single-family homes in the St Louis area during the 12-month period ended September 30, 2022, a decrease of 8.89% from the same period a year ago when there were 4,938 permits issued, according to the latest data from the Home Builders Association of St. Louis & Eastern Missouri (St Louis HBA). Five of the seven counties covered in the report saw a decrease in building permits from the same period a year ago with three of the counties have a double digit decline.
St Louis New Home Building Permits -September 2022
New Home Building Permits In St Louis For Most Recent 12-Months Decline Over 8 Percent
The National Association of Home Builders (NAHB) and Wells Fargo, jointly publish quarterly their Housing Opportunity Index (HOI) which shows the affordability, or lack thereof, of homes to a typical family. To arrive at an index value the median home price of recently sold homes for an area is taken into account as well as the median income for a family in that area. From this data the index is computed to show how affordable the typical home is to a typical family. The higher the index, the more affordable homes are to buyers in that market and the lower the index the less affordable.
For the 3rd quarter of 2022, the HOI index hit the lowest level (meaning homes were less affordable) since the inception of the HOI in 2012. As the chart below shows, the current Housing Opportunity Index for the U.S. is at 42.2% meaning just over 40% of families can afford to buy a home in their area. This is down slightly from 2nd quarter but down quite a bit from the first quarter of this year when it was 56.9%.
Affordability in St Louis is much better…
The NAHB/Wells Fargo Housing Opportunity Index is also produced for metro-areas. For the third quarter of this year, St Louis had a HOI index of 74.8, over 30 points better than the national index! This means a typical home in St Louis is affordable to about 30% more of St Louis families with a typical income than on the national level.
NAHB/Wells Fargo Housing Opportunity Index (HOI)
(click on chart for current, live, interactive chart)
")
The National Association of Home Builders (NAHB) released their NAHB/Wells Fargo Housing Market Index (HMI) report for October 2022 and, not surprisingly, it shows the builders are continuing to lose confidence in the market. As our chart below shows, the Housing Market Index (HMI), the red line, peaked in November 2020 at 90 and has, with the exception of a few minor upticks along the way, fallen ever since reaching 38, the lowest level since August 2012 when it fell to 37.
Single Family Housing Starts and HMI Index 1985-2022 (NAHB)
")
Yesterday, Fannie Mae released their October housing forecast in which they forecast, among other things, where home sales and prices are headed. The report incudes a forecast for next year, which included:
- Home prices in 2023 to decline 1.5% from 2022
- Home sales to finish 2022 down nearly 18% from last year and drop another 22% in 2023
- New home construction to end 2022 down 3.6% from last year and drop another 25% in 2023.
- Mortgage Interest Rates will continue to rise the rest of these year, ending the year at 6.7% and then will ease back to 6.4% in 2023.
See Fannie Maes Complete Housing Forecast HERE
There were 4,486* building permits issued for new single-family homes in the St Louis area during the 12-month period ended August 31, 2022, a decrease of 8.93% from the same period a year ago when there were 4,926 permits issued, according to the latest data from the Home Builders Association of St. Louis & Eastern Missouri (St Louis HBA). Six of the seven counties covered in the report saw a decrease in building permits from the same period a year ago with four of the counties haveing a double digit decline.
*The city of St Louis did not report building permit data for August 2022. Last year there were 54 permits issued in August, if we assume the same number for this year, the City of St Louis would of had an increase of 5.6% for the period, and the overall drop in building permits for the St Louis area would have been 7.8% rather than the 8.93% shown…
St Louis New Home Building Permits -Aug 2022

There were 4,600 building permits issued for new single-family homes in the St Louis area during the 12-month period ended July 31, 2022, a decrease of 8.06% from the same period a year ago when there were 5,003 permits issued, according to the latest data from the Home Builders Association of St. Louis & Eastern Missouri (St Louis HBA). Five of the seven counties covered in the report saw a decrease in building permits from the same period a year ago with three of the counties have a double digit decline.
St Louis New Home Building Permits -July 2022

I saw dozens and dozens of headlines yesterday reporting that mortgage interest rates had fallen below 5% on a 30-year fixed rate mortgage. The catch is on the day that was reported, yesterday, interest rates were actually above 5% on a 30-year fixed-rate loan. As our chart below shows, the MND Rate index was reporting 5.09% and, below that, Optimalblue was reporting 5.326%. Both of the aforementioned charts are updated daily and considered by many in the industry to have the most current and accurate information.
How could all the big headlines be wrong?
Well, actually the articles I scanned were not wrong in what they were reporting, the headline would just give many home buyers a different impression perhaps than what was actually being reported. What prompted the headlines was yesterday, like every week on Thursday, the Freddie Mac Primary Mortgage Market Survey® (PMMS®) results were released. In Freddie Mac’s report, it showed the average 30-year fixed rate mortgage was 4.99% (see the Freddie Mac chart at bottom). The catch is, the survey is done from Monday through Wednesday of the week and then the results reported on Thursday. Many lenders submit their rates to Freddie Mac on Monday meaning by the time the report comes out they are 3-days old. A lot happens in the mortgage market in 3-days, in fact a lot can happen during one day. Oh yeah, the other thing worth noting is if you read the details on the Freddie Mac survey the stated rate was only obtained by paying 0.80 in points, so 8/10 of 1% of the loan amount would be paid up front to get that rate.
Freddie Mac’s Survey Is Very Valuable and Relevant
[xyz-ips snippet=”Interest-Rates-and-Mike-McCarthy-Promo”]

