For the past few years now, we’ve experienced quite the seller’s market in St Louis fueled, in part, by a low supply of homes for sale. As a result, St Louis home prices have increased over the past few years at rates close to double the historic norm. Of late, we’ve heard a lot from people within, and outside of, the real estate industry expressing concern that home prices have gotten too high and even some have made comparisons to 2008 when the housing market saw the bubble burst. Being the data nerd I am, I’ve tried to keep emotion out of it and instead turn to the data to see if there were indications that perhaps St Louis home prices have increased too much and we are in for a correction. Up until now, the data has led me to believe that St Louis home prices were ok and can be sustained. However, based upon current data, I have a little different opinion as I write this.
So what has changed in the data to indicate home prices are too high?
For starters, I haven’t said St Louis home prices are too high yet, I’ve just said that the current data has changed my opinion. Having said that, prices may in fact reached levels that cannot be sustained and may need a downward correction to put them back in line or they may have just peaked and will remain rather flat for a period of time to allow the market to “catch up” with the prices. And, of course, data over the next month or two could change for the positive and show we’re not there yet and home prices can still go higher without a problem. For now, I’m going to say that, based upon the data as well as the normal seasonal adjustments we see this time of year, I’m going to expect to see St Louis home prices to decline somewhat during the winter months like normal, but then perhaps remain relatively flat come spring rather than increase in the spring like normal.
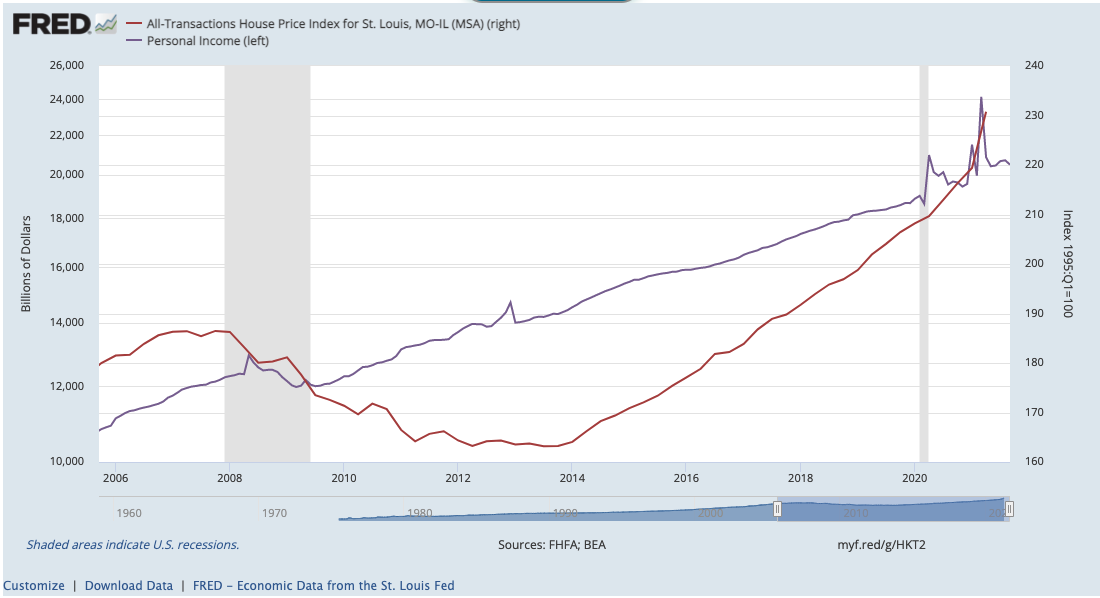
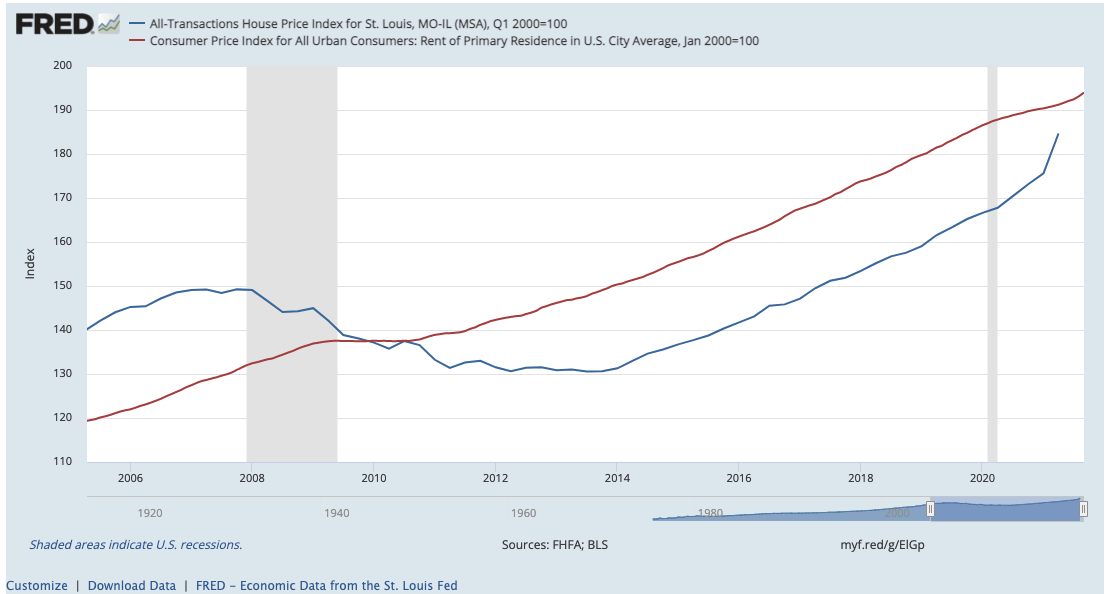
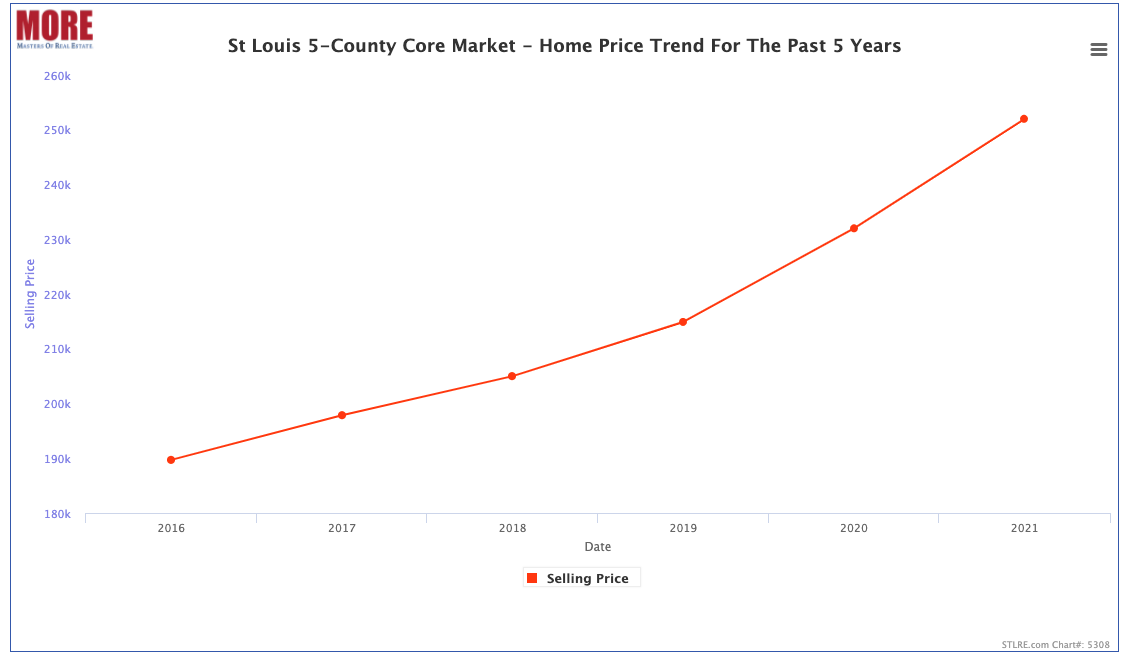
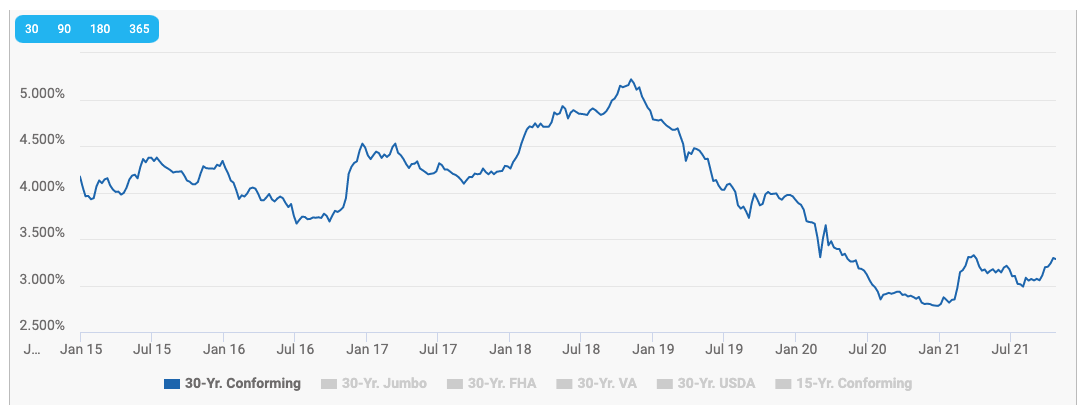
My opinion is based upon several pieces of data that, collectively, are indicating a coming adjustment in home prices to me. I have the charts below that illustrate this point and here’s my recap on them:
- St Louis Home Prices vs Personal Income – The red line shows the home price index for the St Louis MSA and the purple line shows personal income. If you look at the left side of the chart you will see 2006 and the relationship between home prices and income at the peak before the fall. Then, if you look at the right side, you’ll see there was a spike in income last year and at the time home prices were just slightly below, but income has went back down to normal leaving a gap between home prices and income very similar to 2006.
- St Louis Home Prices vs Rent – The blue line shows the St. Louis MSA home price index and the red line shows the Consumer Price Index for average rent of primary residence in U.S. cities. Again, if you look to the left side at 2006, you will see the gap between home prices and rent (historically the lines run pretty close together). On the right you can see the home price index line trending upward toward rent. This chart only reflects home price data through the 2nd quarter so when the 3rd quarter is reported I’m expecting the two lines to converge.
- St Louis Home Price Trend – Past 5 Years – This chart shows the median sold price (by year) for homes sold in the St Louis 5-county core market for the past 5-years. Median price has increase 33% from $189,700 in 2016 to $252,000 this year, an average of 6.6% per year, or roughly 50% higher than the long-term historic norm of about 4%. Granted, there are periods of time that this is necessary, such as was the case in late 2011 after home prices had fallen significantly for about 3 years so there was ground to make it. However, that is not the case now so while I don’t think from this we can predict exactly when a change will occur, or whether that change will be a “flattening” or “decline”, however, this coupled with the other data helps me come to the conclusion I’ve come to today.
- St Louis Home Interest Rates – Interest rates have a significant impact on the cost of a home since most home buyers take out a mortgage when purchasing a home and base their buying decisions more on the payment than the home price. So, if interest rates and home prices increase at the same time, particularly if one or both are doing so at higher than historic rates, something has to give eventually. Rates have been increasing and are currently at 3.284% which is still attractive from a historic perspective, if they continue to rise home prices are going to have more negative pressure on them. When looking at this chart you will see interest rates hit 5.2% in late November, so it would be plausible to argue that even rates that high didn’t impact the market. However if you will go back to my price chart, you will see from 2017 to 2018 home prices only increase 3.6% and from 2018 to 2019, while rates were coming down off the high of 2018, home prices increased at a higher rate, 4.8%. This clearly indicates the impact on home prices interest rates have. To put it in perspective, home prices from last year to this year this far, have increase at 8.6%.
St Louis Home Prices vs Personal Income Chart
(click on chart for live, interactive chart)
St Louis Home Prices vs Rent Chart
(click on chart for live, interactive chart)
St Louis Core Market Home Prices Past 5 Years
(click on chart for live, interactive chart)
St Louis Home Loans Mortgage Interest Rate Trends -Jan 2015 – Present Chart
(click on chart for live, interactive chart)


