House flipping, something that has become quite popular among investors over the past few years and has even spawned several reality TV shows, continues to decline in terms of the number of flips. This is certainly not due to a lack of interest but instead a lack of opportunities. Many flipping opportunities are the result of foreclosures and with the mortgage delinquency rates continuing to improve resulting in declining foreclosure rates, the end result is few opportunities for investors to flip homes.
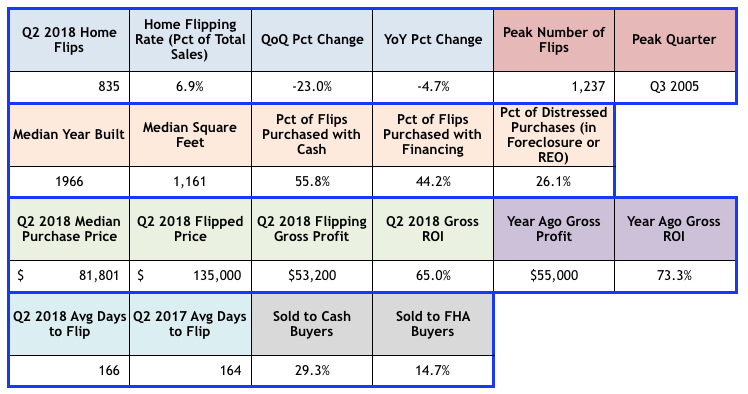
In St Louis, during the 2nd quarter of 2018, there were 835 homes flipped in the St Louis metro area, a decline of 23.0% from the quarter before and a 4.7% decline from a year ago. This is down 32.5% from the peak during the 3rd quarter of 2005 when there were 1,237 homes flipped in St Louis.
The table below shows the 2nd quarter house flipping data for St Louis, from ATTOM Data Services and includes the median size and age of the homes flipped, as well as median time to flip, prices and profits.
[xyz-ips snippet=”Foreclosures-For-Sale-and-Homes-For-Sale”]
St Louis House Flips – 2nd Quarter 2018


