 I don’t know that “hot” comes to mind when I think about any St Louis real estate market today, however, relative to the rest of the market, I think I can identify some St. Louis real estate markets that I feel are poised to perform better in 2013 than other St Louis markets. Below are my charts showing some key market data for the top markets. Included in my data are 4 pieces of information that I think are key to determining the health of a local real estate market:
- Home prices – I show what prices have done over the past 12 months. For a “healthy” market we would expect prices to be generally on the rise however, we don’t want them increasing at too fast of rate as, like we learned from the bubble, this is not good.
- Inventory of homes for sale – Excess inventory of homes for sale put a damper on the market for some time and, as the basic law of supply and demand dictates, generally brings prices down…therefore I’m looking for inventories that have declined to near normal levels.
- Days on market – another indicator of supply and demand in a market….for a market to be healthy we would expect to see homes sold within a reasonable period of time
- Market Action Index – This gives us a quick snapshot of the health of the market focusing primarily on the balance of supply and demand. A “30” would be a balanced market not favoring buyers or sellers, above a 30 (up to a maximum of 60) indicates a “hot” market favoring sellers, below 30 (down to a low of 0) indicates a “cold” market and favors buyers. After what the real estate market has been through over the past 5 years, anything in the mid 20’s is great and a 30 is a real eye opener today.
St Louis Real Estate Markets Expected to Perform Well in 2013:
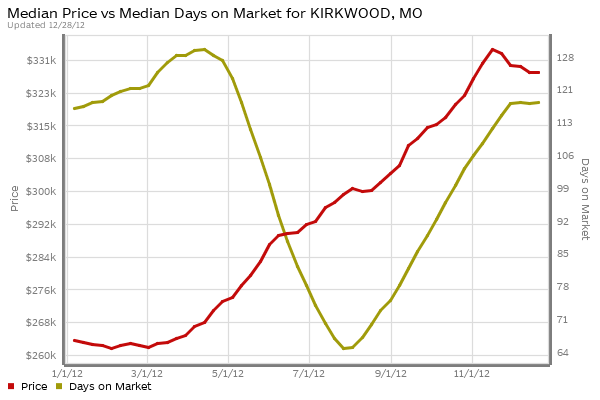
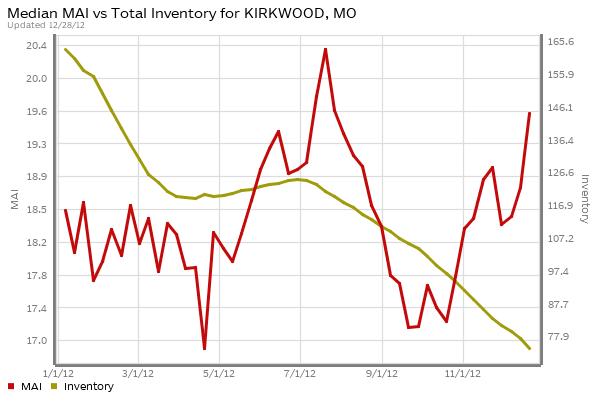
Kirkwood – The median home price in Kirkwood has increased 24 percent in the past year and the days on market, while at about the same level as a year ago, is at a healthy number right around the 4 month mark. Our market action index for Kirkwood is just under 20, which is on the low side of what I would like to see, but with the inventory of homes for sale down over 50 percent in the past year I expect the MAI will increase soon.
© 2012 MORE, REALTORS
© 2012 MORE, REALTORS
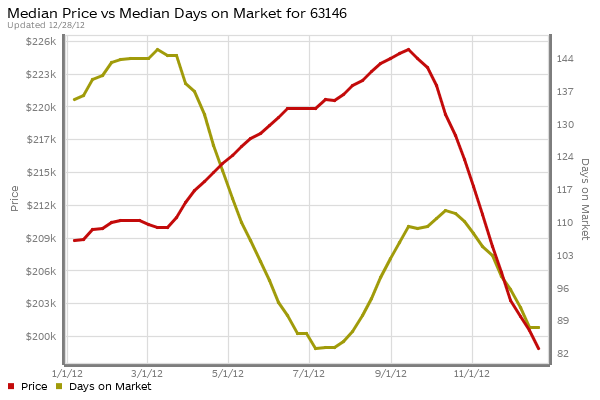
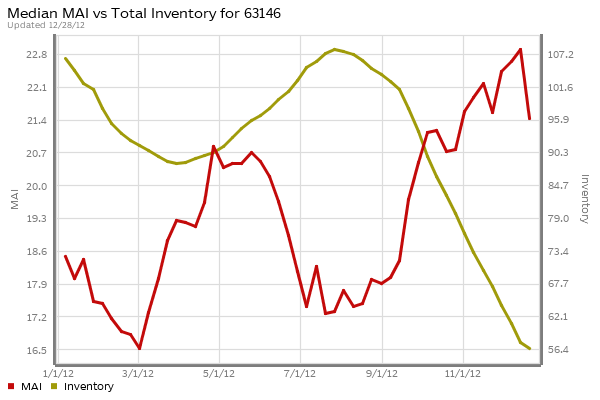
63146 Zip Code – This area includes parts of Creve Coeur and unincorporated St. Louis county and has seen home prices fall almost 5 percent in the past 12 months. This almost kept me from including this area on my list of hot markets for 2013 however with days on market falling 35 percent in the past year to a rather low 89 days, our market action index increasing 15 percent in the last 12 months to 21.4 and the inventory falling by almost 50 percent, I think the 63146 zip code area is poised to perform well in 2013.
© 2012 MORE, REALTORS
© 2012 MORE, REALTORS
63017 Zip Code – This area of Chesterfield saw home prices rise 7 percent in the past year while the days on market fell by almost 17 percent to about 4 months. Our market action index for 63017 is up over 20 and has increased about 10 percent in the past year while inventory fell about 23 percent during the past year. This area should perform well in 2013.
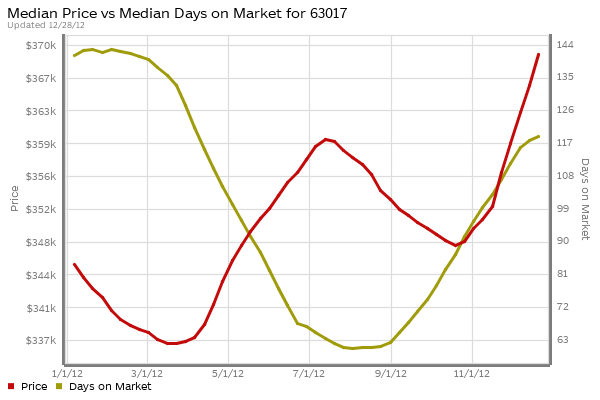
© 2012 MORE, REALTORS
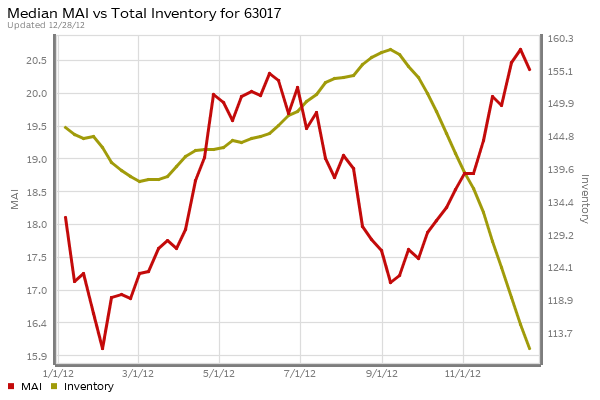
© 2012 MORE, REALTORS
63132 Zip Code – This area includes unincorporated St. Louis County around University City and Olivette, as well as parts of both of those areas, and saw home prices increase 11 percent in the past year while days on market increased 20 percent as well but, at 102 days, is still in a very healthy range. Our market action index for this area is at 25, a 38 percent increase in the past year. Inventory has grown significantly in the past year but thus far demand seems to have kept up. This area is more volatile then the others in my list due to some of the weaker fundamentals, but I still think it is poised to do well in 2013.
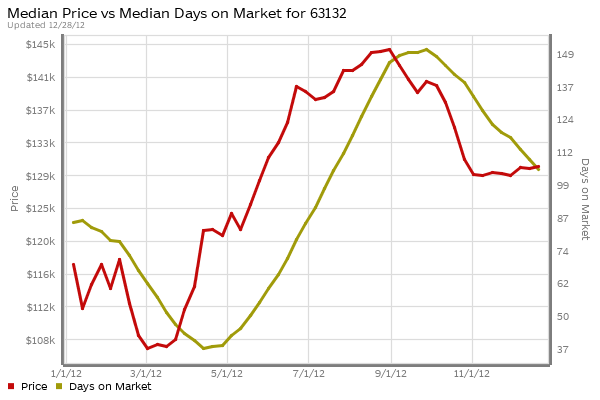
© 2012 MORE, REALTORS
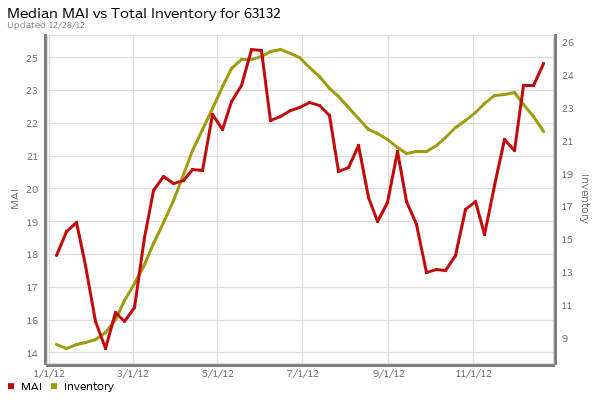
© 2012 MORE, REALTORS
Up and comers…The two areas below have been plagued with foreclosures and other distressed sales which has beat down prices significantly over the past few years and flooded the market but are now seeing the “light at the end of the tunnel”.
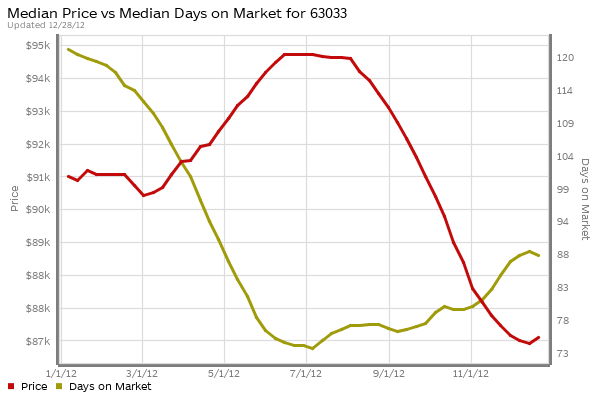
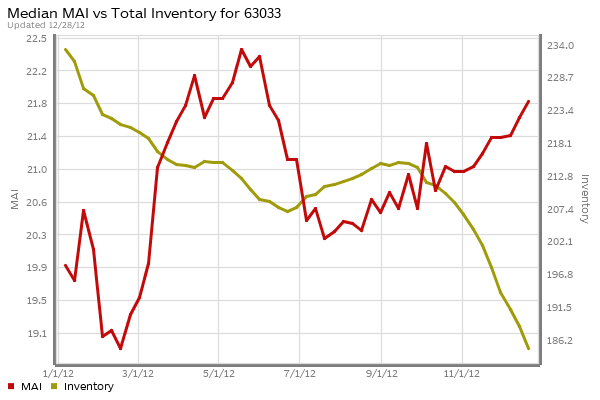
63033 Zip Code – This area consists of parts of Florissant as well as unincorporated St Louis county and saw home prices fall about 25 percent in the past year, due largely to the high concentration of distressed sales in this area, while days on market dropped over 20 percent to an impressive 88 days. Our market action index for this area is at 21.8, about a 10 percent increase in the past year and inventory has dropped about 20 percent. While prices have fallen, recently they appear to have stabilized and, as we see the percentage of distressed sales continue to fall in this area, should be able to start to rise somewhat in 2013.
© 2012 MORE, REALTORS
© 2012 MORE, REALTORS
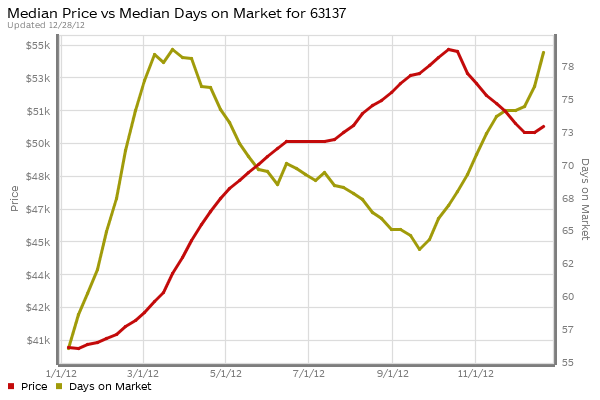
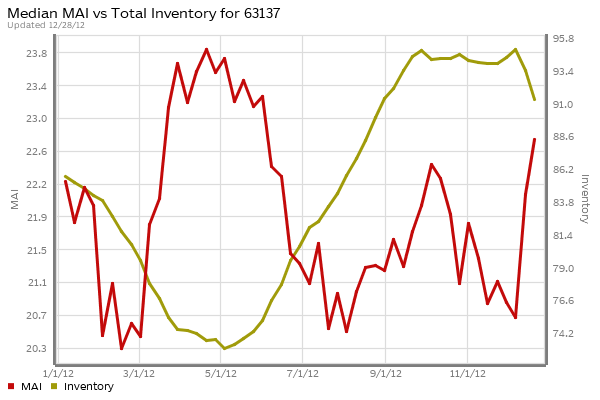
63137 Zip Code – This area includes Bellefontaine Neighbors as well as unincorporated St. Louis County in the area and saw home prices increase by 25 percent in the past year (largely due to fewer distressed sales) and while days on market has increased, it is still below 3 months which is good. Our market action index for this area is 22.6 and inventory has grown fairly significantly in the past 12 months causing me some concern and hence why 63137 is on the “up and comers” list rather than the “hot markets” list.
© 2012 MORE, REALTORS
© 2012 MORE, REALTORS
So there you have it, some of the St. Louis Real Estate markets that appear poised to perform well in 2013. If you would like information on any other St. Louis neighborhood (or any metro in the U.S. for that matter) please contact me and I will be happy to provide it.


Leave a Reply
You must be logged in to post a comment.