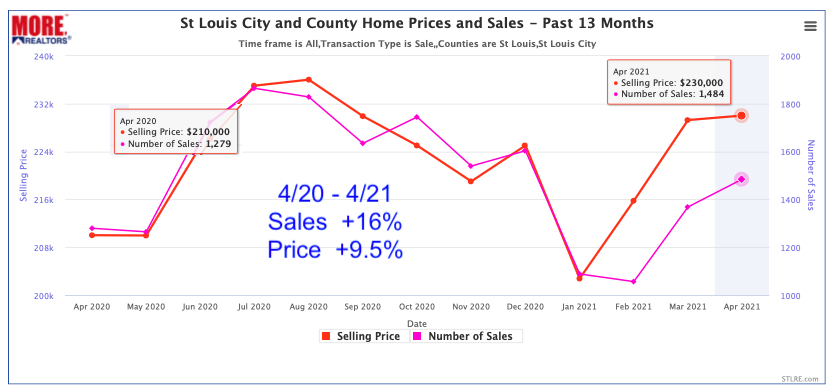
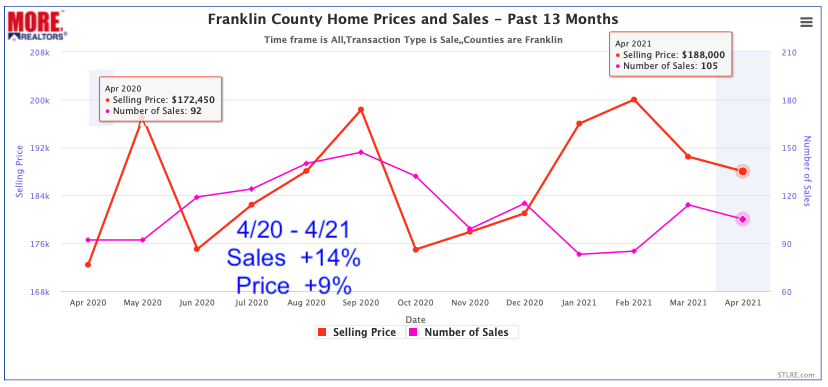
In spite of the challenge of a low-inventory housing market, St Louis City and County, St Charles County and Franklin County all saw double-digit increases in the number of homes sold in April while Jefferson County saw a double digit decline. As the charts below illustrate, the median price of homes sold in those counties increased from a year ago in all the counties, two of them in the double digits.
Not all housing data is the same….nor accurate for that matter…
One thing worth noting is that there are housing market reports out there from many different sources, including many credible ones that may or may not be accurate. In most cases this is not due to an error on the part of the person or entity sharing the data but a result of either bad data, inaccurate data or misinterpreted data. For example, when preparing to write this article I noticed two different reports on “St Louis” home prices for homes sold in April. One, which indicated it was for St Louis City and County combined, reported $250,000 and one which reported the “St Louis area” was $266,000. In the case of the latter, my first guess was that they were reporting data for the St Louis MSA but when I checked that the actual sold price in April was only $223,750 so I have no idea where the data came from. For the former, the $250,000 median price is not only higher than the median price for St Louis City and County, it’s higher than the median price for the whole MSA and while the source is indicated, I’m not sure how this number was arrived at.
So what does it matter?
In the crazy market we are in where buyers are getting in bidding wars to get a home, I think it’s more important than ever to have good, relevant and accurate data available to your agent so your agent can help you make an informed decision. You ultimately may decide to pay above what you think the current value of the home is but it would help to know what the real value is. If you look at my chart below for St Louis City and County you’ll see the median price of homes sold in April was $230,000 which is quite different than the $250,000 price and $266,000 I saw reported elsewhere. Would being $20,000 – $36,000 off on the value matter to you? I think it might.
So how do I know I’m right?
Well, for starters I’m a data junky and for the past dozen or so years I’ve probably spent, on average about a dozen hours a week or more studying market data for St Louis. In addition, for the past 6 or 7 years we have worked to develop our own proprietary software to compile and report housing data and are constantly checking and double checking the output. Finally, we have a very credible source for data, the REALTOR® MLS and we constantly update and check the data. Put all of this together and while there’s no way to say it’s 100% correct, but I’m confident it’s about as close as you can get.
[xyz-ips snippet=”Homes-For-Sale”]
St Louis City and County Home Prices and Sale – Past 13 Months
(click on chart for live chart)
Franklin County Home Prices and Sale – Past 13 Months
(click on chart for live chart)
Jefferson County Home Prices and Sale – Past 13 Months
(click on chart for live chart) 
St Charles County Home Prices and Sale – Past 13 Months
(click on chart for live chart) 
[xyz-ips snippet=”Homes-For-Sale”]


