I’ve written a couple of articles lately addressing the news reports about the housing market cooling down. As I’ve addressed in those articles, there has not really been much data supporting a significant cooling in the St Louis real estate market. Additionally, I’ve noted that, due to the seasonality of the housing market, and the fact we are headed toward winter, a cooling of the market would be the seasonal norm.
So today, I decided to pick an easier question to answer, “has the St Louis real estate market peaked?” The short answer is yes, I believe it has. This statement, by itself, is not all bad as it would NOT be good for St Louis home prices to continue to increase at the rates they have over the past couple of years. Not to mention, if we stay in this low-inventory market strongly favoring sellers much longer, many buyers are going to just give up and shelf the idea of buying for a while.
As usual, I’ll let the data speak for itself. I have several charts and tables below (available exclusively from MORE, REALTORS®) that I believe support that we have probably seen the St Louis market peak.
St Louis 5-County Core Market – Home Sales Trend
(click on chart for live, interactive chart)
As the chart above illustrates, the 12-month home sales trendline (the green line) hit its peak in June. dipped a little in July and then has been flat the last two months. The time it takes for a home to sell (days on market, represented by the brown line at the bottom) also hit its “peak” (in this case the lowest) at 6 days in June, then has risen since to 10 days for September. Finally, the median sold price per foot (the red line) peaked in July at $171 per foot, and has settled to $170 per foot for August and September.
St Louis Real Estate Trends Report
New Listings & New Sales (click on report for live report)
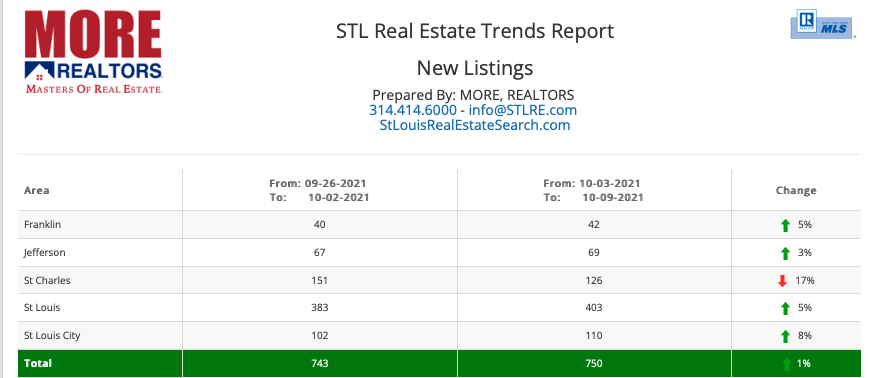
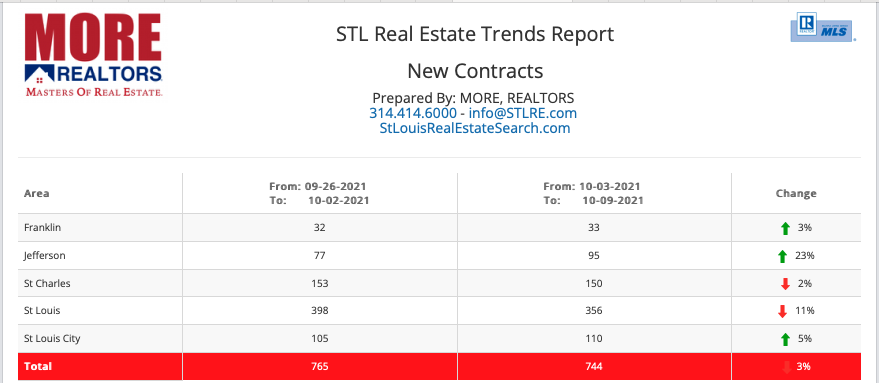
The above reports are “leading indicator” reports, meaning we can glean from them what is going to happen to home sales to some extent before it happens (or at least before the sales close). The listing report shows there were 750 new listings in the St Louis 5-county core market the most recent week, up just about 1% fromt the week before. The new contracts report for the same week shows new contracts written declined about 3$% from the week before. The net result is, during the most recent week of data, new listings exceed new sales by nearly 1% compared with the prior week when new sales exceeded new listings by 3%.
St Louis Area Supply of Listing Inventory
(click on report for live report)
The report above shows there is currently a 0.92 month supply of homes for sale in the St Louis 5-County market (up slightly from a 0.89 month supply about 3 weeks ago) and a 0.96 month supply in the St Louis MSA, up from 0.92 3 weeks ago.


