As 2015 quickly comes to an end, we close out what has been one of the better years for the St Louis real estate market in many years! Homes in St Louis sold at a steady pace and St Louis home prices showed solid appreciation! We saw a spring market that brought home buyers racing to new listings often competing with other buyers to see who could make the best offer the quickest, often-times with the final sale price equaling or exceeding the asking price followed by a steady market throughout the summer and into the winter months.
Too much to read? No problem, watch the video below instead!
St Louis Real Estate Market – Recap for 2015:
While the year is not quite yet over, and there will be some additional sales closing in the 4 business days left in the year, I think there is enough data available to tell the story for this year. With that in mind, below is a recap of the St Louis housing market for 2015:
Search St Louis Homes For Sale HERE
See ALL Homes That Will Be Open In St Louis This Weekend
Get The Latest LIVE St Louis Home Prices, Sales and Other Market Data HERE
- Home Sales & Prices:
- St Louis 5-County Core Market
- Home sales increased about 1 percent from 2014
- Median sales price of homes sold was $172,500 for 2015, an increase of 6.48% from 2014 when the median sales price was $162,000
- St Louis 5-County Core Market

- Days on Market (cdom) and Months Supply of Homes for Sale:
- St Louis 5-County Core Market
- There was a 6 month supply of homes for sale at the beginning of 2015, one-month less than the beginning of 2014 when there was a 7 month supply and it is down to a 5 month supply now, higher than the 4 month supply we closed out 2014 with.
- In January of this year, the median time an active listing had been on the market was 52 days, down significantly from 69 days the year before, and, as of now, active listings of homes for sale in St Louis have been on the market a median of just 35 days, down from 49 days this time last year.
- St Louis 5-County Core Market

- Sale Price to Listing Price Ratio:
- St Louis 5-County Core Market
- We started off this year with homes selling for a median of 97.2 percent of the current list price at the time of sale, compared with 96.7% the year before, and this month homes sold for 97.8% of current list price, compared with 97.2% a year ago.
- In January of this year homes sold for 94.7 percent of their original list price, an improvement from a year earlier when it was 93.7 percent. This month homes have been selling for 95.7 percent of their original list price, compared with 94.4 percent a year ago.
- St Louis 5-County Core Market

St Louis Real Estate Market – Outlook for 2016:
There are many things that could seriously impact where the St. Louis real estate market is headed next year including the national and local economy, however, assuming nothing dramatic happens that changes the current trends, here is how I see the St Louis housing market shaping up for 2016:
- Forecast for 2016:
- St Louis 5-County Core Market
- Home sales – around 24,000 home sales, roughly the same as 2007, which equate to an increase in home sales of about 4% from 2015.
- Home prices – most likely less of an increase than the nearly 6.5% increase we saw last year…anticipate the median home price hitting around $180,000 in 2016 for an increase of 4.5%.
- Inventory and Supply – while the inventory will grow as we head into spring the supply of homes for sale should remain in seller’s market territory, below 6 months, for most of the St Louis market.
- St Louis 5-County Core Market
- The data behind the forecast:
- Just so you know that my forecast is not “wishful thinking”, below are some charts and data for the St Louis housing market, as well as economic conditions, that I have taken into consideration when forming my rather optimistic outlook for the St Louis real estate market in 2016.
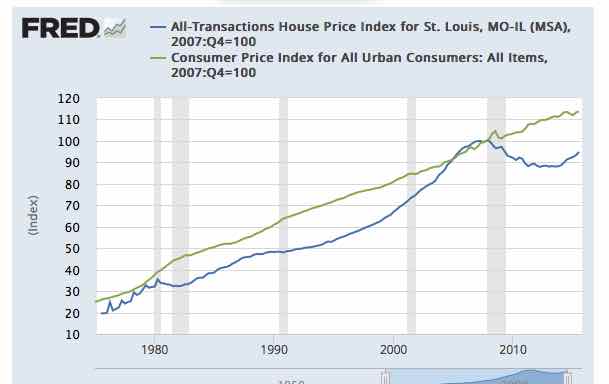
- St Louis Home Prices vs Inflation Rate:
- As the chart below shows, St Louis home prices (blue line) follows a trend-line that normally parallels the CPI index trend (green line)- during the bubble years, St Louis home prices increased at a greater rate than inflation but presently appears to be lagging below what would be the typical trend.
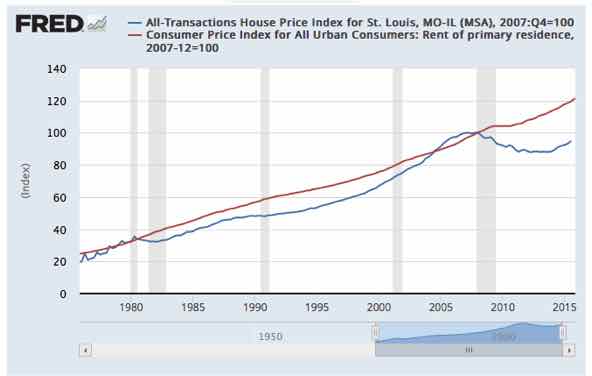
- St Louis Home Prices vs Rents:
- As the chart below shows, St Louis home prices (blue line) generally increase at a rate that is fairly consistent with rental rates (red line). Home prices fell behind in the ’90’s which helped fuel the rapid increase in St Louis home prices in the 2000’s which ultimately led to the crash of the market. Presently, home prices are behind rents again. Now, this could indicate rents are too high, or home prices are too low. Given the demand for rental and the lack of a significant change in the rate of rental rates, I’m going to go with home prices coming up more than rents coming down. Having said that, I do believe, with the addition of the thousand’s of new rental units being added to the St Louis market, there will be some downward pressure perhaps on rents in the coming year, but I still think the data suggests home prices continuing to rise at a little higher than normal rate.
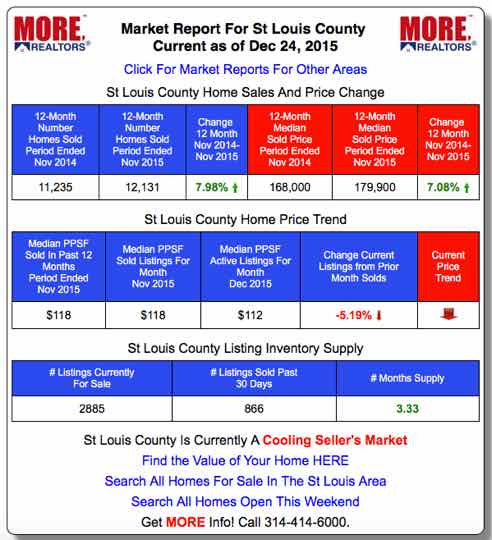
- St Louis County Current Market Data and Trend:
- As the table below shows (see live market data like this for all St Louis area cities, zips and counties at STLMarketData.com), currently, St Louis County is in a sellers market with about a 3 1/3 month supply of homes for sale and, while home prices are currently trending downward due to the seasonality of home prices) the 12 month trend for the period ending November 30th, 2015 was up over 7 percent. This data represents a fairly strong housing market in St Louis county at this time of year and supports the idea we will have a good spring market.
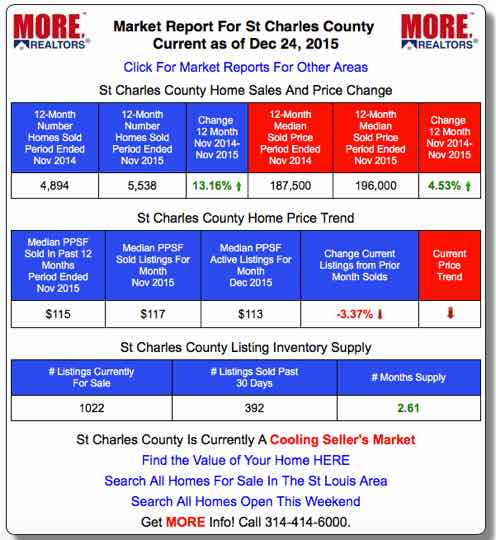
- St Charles County Current Market Data and Trend:
- As the table below shows (see live market data like this for all St Louis area cities, zips and counties at STLMarketData.com), currently, St Charles County is in a sellers market with an extremely low supply of homes for sale (just over 2 1/2 months) and, while home prices are currently trending downward somewhat due to the seasonality of home prices) the 12 month trend for the period ending November 30th, 2015 was up over 4.5 percent and home sales for the period were up over 13%. This data represents a strong housing market in St Charles county at this time of year and supports the idea we will have a very good spring market.
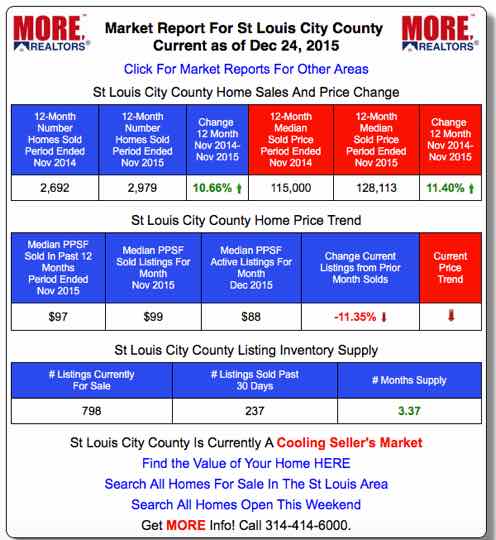
- St Louis City Current Market Data and Trend:
- As the table below shows (see live market data like this for all St Louis area cities, zips and counties at STLMarketData.com), currently, the city of St Louis is in a sellers market with about a 3 1/3 month supply of homes for sale and, while home prices are currently trending downward due to the seasonality of home prices) the 12 month trend for the period ending November 30th, 2015 was up over 11 percent and home sales for the period were up over 10%. This data represents a fairly strong housing market in the city of St Louis at this time of year and supports the idea we will have a good spring market.
- St Louis Home Prices vs Inflation Rate:
- Just so you know that my forecast is not “wishful thinking”, below are some charts and data for the St Louis housing market, as well as economic conditions, that I have taken into consideration when forming my rather optimistic outlook for the St Louis real estate market in 2016.
I could go on with more data to back up my forecast, but I think I have enough here to put most people to sleep by now. The good thing is, after analyzing the market from many different perspectives, I really feel 2016 is going to hold good things in store for the St Louis real estate market!