Based on the data from the recent ATTOM report on U.S. commercial foreclosures, there is a noticeable trend that highlights the challenges and changes in the commercial real estate market over the past decade. The report indicates a significant increase in commercial foreclosures, rising to 625 in March 2024 from a low of 141 in May 2020—a time characterized by pandemic-induced economic shocks and responsive fiscal interventions. This sharp rise represents a 117% year-over-year increase and underscores a broader economic narrative where, despite short-term stabilizations, long-term market corrections have been a constant presence.
States like California, New York, and Florida have borne the brunt of these fluctuations. For instance, California experienced a dramatic 405% increase from last year, showcasing how regional factors and state-specific economic conditions have influenced foreclosure rates. This analysis not only offers insights into the challenges faced by the commercial real estate market but also highlights the sector’s resilience and capacity to navigate through a continuum of economic cycles.
The recent spike in commercial foreclosures has raised questions about the interconnectedness of the commercial and residential real estate markets. Historically, these two sectors have shown some level of correlation, as economic factors affecting businesses often spill over into the residential sphere. For instance, a downturn in commercial real estate can lead to job losses and reduced consumer spending, which in turn can soften the residential market. However, the current trends suggest a more complex relationship, with the residential market remaining relatively stable despite significant upheavals in commercial real estate. In the coming months we’ll see if that trend continues.
The St. Louis MSA has seen a notable decrease in foreclosure filings in the fourth quarter of 2023, with the numbers falling to 851, a 19% reduction from the previous quarter. When we look at the year-over-year data, the decline is even more significant, showing a 46% drop from the fourth quarter of 2022. This downward trend suggests a potentially stabilizing real estate market in the St Louis metro area, with fewer properties entering foreclosure.
Within this broader picture, certain counties have experienced remarkable changes. Monroe County, for instance, recorded a sharp increase of 60% in foreclosure filings from Q3, while Madison County saw filings decrease by 7% in the same period. Saint Clair County, which had faced a high volume of foreclosures, saw a 13% decrease from Q3 2023 and a substantial 79% drop from Q4 2022, reflecting a positive shift for homeowners in the area. This data, encapsulated in the accompanying table, offers a snapshot of the current market conditions and emerging trends in the St. Louis housing landscape.
St Louis Metro Area Foreclosure Filings – 4th Quarter 2023
The St. Louis MSA recorded 311 foreclosure actions in October 2023. This represents a significant decrease of 12% from September 2023 and a substantial decline of 71% compared to October 2022. This suggests a strong recovery or stabilization in the real estate market in the St. Louis area, indicating fewer homeowners are facing foreclosure compared to the previous year.
Month over Month and Year Over Year Change in Foreclosure Activity in the St Louis MSA (By County)
During the 3rd quarter of this year, there were 1,200 properties with foreclosure filings in the St. Louis MSA, according to the U.S. Foreclosure Market Report by ATTOM Data. This marks a 17% increase in St. Louis foreclosures from the prior quarter and an increase of 32% in St Louis foreclosure activity from a year ago.
The table below reveals that the city of St Louis saw the most foreclosures during 3rd quarter, followed by the Illinois counties of St Clair and Madison.
So far this year, up until June 30, there have been 1,973 properties with foreclosure filings in the St. Louis MSA, according to the U.S. Foreclosure Market Report by ATTOM Data. This marks a 5% increase in St. Louis foreclosures compared to the same period last year, a surge of 119% from 2021, and a 5% uptick from 2020.
Now, let’s turn our attention to the counties in Illinois with the most significant increases in foreclosures: Macoupin and Bond…
As depicted in the table below, Macoupin County in Illinois experienced a 63% rise in foreclosure activity this year compared to last, and Bond County saw a similar upward trend with an increase of 60%.
On the other hand, let’s check out the Missouri counties of Jefferson and Warren, where we’ve seen the largest decreases in foreclosures…
The table below reveals that both Jefferson and Warren Counties in Missouri enjoyed a 50% reduction in foreclosure activity this year compared to the previous year.”
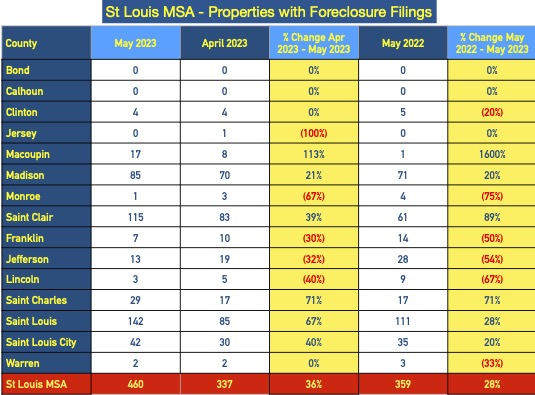
Last month, there were 460 properties with foreclosure filings in the St Louis MSA, according to ATTOM Data’s U.S. Foreclosure Market Report. This represents an increase of 36% in St Louis foreclosures from April 2023 to May 2023 and a 28% increase from a year ago.
Counties of Macoupin, St Charles and St Louis see biggest increases…
As the table below shows, Macoupin County in Illinois saw an increase of 113% in foreclosure activity in May from the month before, St Charles County a 71% increase and St Louis County a 67% Increase.
Last month, there were 307 properties with foreclosure filings in the St Louis MSA, according to ATTOM Data’s U.S. Foreclosure Market Report. This represents an increase of 25% in St Louis foreclosures from January 2022 to January 2023.
It’s not as bad as it sounds…
While a 25% increase sounds bad, the chart below, which shows foreclosure filings for the St Louis MSA since 2006, puts it in perspective. Last year, there were 4,066 total foreclosure actions for the year so even if our foreclosure activity for 2023 would continue to be 25% higher than last years level, it would put us at a little over 5,000 foreclosures for 2023. As the chart below illustrates, if we finished 2023 at that level we would still be on the low end of the spectrum during the past 17 years.
During 2022, there were 4,066 properties with foreclosure filings in the St Louis MSA, according to ATTOM Data’s U.S. Foreclosure Market Report. This represents an increase of 46% in St Louis foreclosures from 2021 and a 48% increase from 2020.
It’s not as bad as it sounds…
While the 2022 increase sounds bad, the chart below, which shows foreclosure filings for the St Louis MSA since 2006, puts it in perspective. The foreclosure activity in St Louis last year, while higher than the two prior years mentioned above, was lower than the 14 years prior. As the chart illustrates, as recently as 4 years ago, there was over 50% more foreclosure activity in St Louis than in 2022 and 5 years ago, in 2017 it was nearly double.
Having said that, we will likely see the foreclosure activity continue to increase and I am confident that the St Louis foreclosure activity in 2023 will surpass 2022, but hopefully we won’t get to the levels we’ve hit in the recent past.
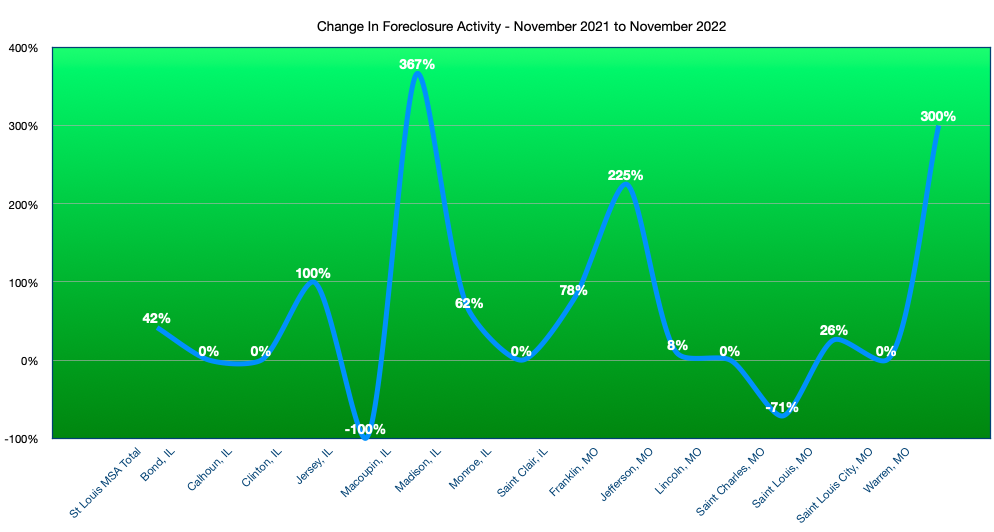
During November, there were 255 properties with foreclosure filings in the St Louis MSA, according to ATTOM Data’s U.S. Foreclosure Market Report. This represents an increase of 42% in St Louis foreclosures from November of 2021 but is a decline of over 76% from the prior month, according to the report.
As the chart below shows, 8 counties reported an increase in foreclosures from a year ago, 2 counties had a decrease in foreclosure activity and 5 had no change in activity. Macoupin County, Illinois saw the largest increase at 367% followed by Warren County, Missouri at 300%.
During the third quarter of this year, there were 907 properties with foreclosure filings in the St Louis MSA, according to ATTOM Data’s U.S. Foreclosure Market Report. This represents an increase of 44.43% in St Louis foreclosures from the same quarter a year ago but is a decline of 16% from the second quarter of this year, according to the report.
As the table below shows, with the exception of Bond County in Illinois, all 15 counties reported had an increase in foreclosure activity during the 3rd quarter over last year, and all at least a double-digit increase. Lincoln County, Missouri saw the largest increase at 325% followed by Macoupin County, Illinois at 293%. Only five of the 15 counties saw an increase in foreclosure activity from the prior quarter.
Given the inflation numbers announced yesterday, rising interest rates and the rest of the economic challenges that exist we are likely to see a continued increase in foreclosure activity for the foreseeable future.
Last month, there were foreclosure filings on 19,479 properties in the U.S., according to ATTOM Data’s U.S. Foreclosure Market Report. This represents a decline of 5% from the month before but a 94% increase from a year ago, according to the report.
Let’s put it in perspective…
Data and statistics are funny things. Even when accurately presented they can paint a picture that may sound worse, or better than the real situation behind the data. This is why I consistently suggest that people don’t base opinions of the market, or make decisions, on one piece of data. It takes many pieces of data to really paint the whole picture, just like in this case. The headline that was reported by ATTOM Data (and repeatedly in many publications) is accurate, foreclosures are up 94% from a year ago. But if there are currently 19,479 properties with a foreclosure filing, that means there were just 10,040 filings a year ago. Granted, its bad to have anyone lose their home, but, historically speaking, these foreclosure numbers are low..very low. For example, in April 2010, a couple of years after the housing bubble burst, there were 367,056 foreclosure filings that month. So, last months number of 19,479 is 94% lower than April 2010.
Again, I’m not minimizing the significance of a foreclosure or the effect it has on those affected by it, I’m just trying to paint a more clear picture to show at this time, even though we’ve seen an increase, the numbers are still pretty low.
The Consumer Financial Protection Bureau (CFPB) earlier this week proposed rule changes that would help prevent “avoidable foreclosures” that will come about when the current foreclosure ban expires June 30th. According to the CFPB, nearly 3 million homeowners are delinquent on their mortgages as a result of the COVID-19 pandemic as well as the economic issues that have come about as a result.
The CFPB’s proposed rule changes include:
Require a pre-foreclosure review period that would generally prohibit loan servicers from starting foreclosure until after December 31, 2021 on loans secured by a borrower’s principal residence.
Permit loan servicers to offer “certain streamlined loan modification options to borrowers with COVID-19-related hardships.”
The CFPB is going to accept comments on their proposed rules until May 11, 2011 and then afterward will decide how to proceed.
[xyz-ips snippet=”Homes-For-Sale”]
About the CFPB (from their website)
The Consumer Financial Protection Bureau (CFPB) is a 21st century agency that helps consumer finance markets work by making rules more effective, by consistently and fairly enforcing those rules, and by empowering consumers to take more control over their economic lives. For more information, visitwww.consumerfinance.gov.
President Joe Biden on Tuesday extended the ban on home foreclosures for federally backed mortgages until June 30, 2021. This is the second extension of the ban which was originally set to expire January 31, 2021, but then previously extended by President Biden to March 31, 2021.
Meanwhile, as the chart below shows, serious delinquencies on home mortgages have been on the rise since nearly the beginning of the pandemic almost a year ago. The ban on foreclosures is certainly a welcome relief to those struggling to make their house payments. However, with such a high delinquency rate one has to wonder if it is just delaying the inevitable and that this is sort of a ticking time bomb for the real estate market? I say that because with the number of mortgage delinquencies piling up it is safe to assume that once the ban is over there will be a massive amount of foreclosures hitting the market which may very well have a negative impact on the market.
Zombies are on the rise in St Louis! I’m referring, of course, to Zombie foreclosures and not the spooky creatures from scary movies. A zombie foreclosure is a property that is in “pre-foreclosure” meaning it is in the foreclosure process but has not been yet foreclosed upon and is vacant or abandoned by the current owner. We saw the levels of zombie foreclosures rise significantly after the housing bubble burst back in 2008 but then fall around 2012 as the market began its recovery. For the 3rd quarter of 2020, according to ATTOM Data Research, 10.8% of the homes in pre-foreclosure were vacant or otherwise known as “zombies foreclosures”. This is a fairly significant increase in the zombie rate from the prior quarter when 7.79% of the pre-foreclosures were vacant. A year ago, during the 3rd quarter of 2010, the zombie foreclosure rate was 7.77%.
St Louis vacant property rate rises during 3rd quarter as well..
As the table below also illustrates, 2.95% of the more than 1,000,000 residential properties in the St Louis MSA were vacant during the 3rd quarter of 2020 which is an increase from 2.88% for the 2nd quarter of 2020 as well as an increase from a year ago when the vacancy rate was 2.86%.
The foreclosure rate for the St Louis MSA during February increased 22.55 percent from the prior month but declined 12.0% from February 2019, according to data just released from ATTOM Data Solutions. As the table below shows, only 3 counties in the St Louis metro area saw a decline in foreclosure activity in February from the month before but 10 of the 15 counties reported saw a decline in foreclosure activity from a year ago.
Three counties, Madison in Illinois and St Louis and Lincoln in Missouri, saw a decline in foreclosure activity from both the month before as well as the year before.
In response to the coronavirus pandemic, the U.S. Dept. of Housing and Urban Development (HUD), as well as the Federal Housing Finance Agency (FHFA) (which oversees Fannie Mae and Freddie Mac), directed their loan servicers to suspect foreclosures and evictions for at least 60 days to help those people affected.
In a statement, Mark Calabria, the Director of the FHFA, said that borrowers affected by the coronavirus who are having difficulty paying their mortgages should reach out to the mortgage servicers as soon as possible.
HUD Secretary Ben Carson said that “The halting of all foreclosure actions and evictions for the next 60 days will provide homeowners with some peace of mind during these trying times,”
Foreclosure rates and mortgage delinquency rates have steadily declined over the past couple of years as the housing market, as well as the overall economy, have both continued to improve and thrive. Nonetheless, foreclosures still take place and during 2019 the St Louis MSA had the 8th highest foreclosure rate of the 20 largest MSAs, according to the latest data released by Attom Data Solutions.
As the table below shows, during 2019, in the St Louis MSA there was 1 foreclosure action for every 232 housing units. Philadelphia, PA, had the highest foreclosure rate of the 20-largest MSAs with one foreclosure action for every 133 housing units and San Francisco had the lowest with one foreclosure action for every 631 housing units.
The foreclosure rate for the St Louis MSA during October decreased 6.0 percent from the month and was down 4.2% from November 2018, according to data just released from ATTOM Data Solutions. As the table below shows, there were, like last month, some mixed results. For example, St Charles County saw a 20% increase in foreclosures from the month before while the City of St Louis saw a 27% decrease from the month before. The U.S. as a whole saw a bigger decline in foreclosure activity than the St Louis MSA did.
The foreclosure rate for the St Louis MSA during October increased 11.3 percent from the month before however, it was still nearly 25 percent (24.5%) lower than October 2018, according to data just released from ATTOM Data Solutions. As the table below shows, there were some real mixed results this month. For example, St Charles County saw a 150% increase in foreclosures from the month before increasing from 10 in September to 25 in October but is down over 60% from October 2018. The city of St Louis is the only county of significant size in the St Louis MSA that saw both an increase in foreclosures from the month before (65.8^) as well as an increase from a year ago (43.2%).
The St Louis foreclosure rate during the 3rd quarter of this year was 1 in every 766 housing units, a decline of nearly 1% from the prior quarter and a decline of over 27% from a year ago, according to data just released from ATTOM Data Solutions. As the table below shows, 6 of the counties in the St Louis MSA saw an increase in the foreclosure rate during the 3rd quarter from the prior quarter and only two counties saw an increase from a year ago.
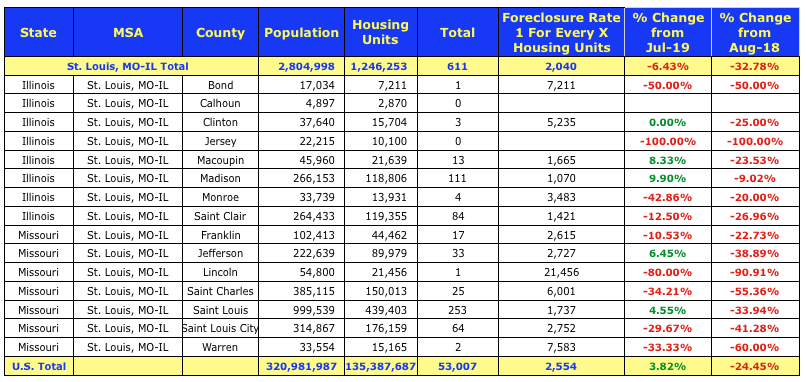
During August there was one foreclosure action for every 2,040 housing units in the St Louis MSA, a decline of 6.43% from the month before and a decline of 32.78% from a year ago, according to data just released from ATTOM Data Solutions. As the table below shows, only 4 of the counties in the St Louis MSA saw an increase in the foreclosure rate for August 2019 from the month before, but all counties saw a decline from August 2018.
The rate of foreclosure in St Louis during the 2nd quarter of this year was 1 foreclosure filing for every 759 housing units, a decrease of 15.68% from the prior quarter and a decline of 18.54% from the 2nd quarter of 2018, according to data just released by ATTOM Data Research. St Louis has the 73rd highest foreclosure rate of the 220 MSA’s ranked in the report.
As the table below shows, only three counties in the St Louis MSA saw an increase in foreclosure activity this quarter from the prior quarter and, with the exception of Lincoln County, none saw an increase from a year ago.
The rate of foreclosure in St Louis in May was 1 foreclosure filing for every 2,013 housing units, an increase of 7.7% from the month before but a decline of 18.8% from May 2018, according to data just released by ATTOM Data Research.
As the table below shows, six counties in the St Louis MSA saw an increase in foreclosure activity in May from the month before however, all the counties in the St Louis MSA except 3, saw a decline from a year ago.
The strong St Louis housing market, as well as the strong economy, continues to help improve mortgage delinquency rates and foreclosure rates in St Louis. The rate of foreclosure in St Louis in April was 1 foreclosure filing for every 2,167 housing units, a decline of 17.4% from the month before when the rate was 1 in every 1,865 housing units, according to the latest data from ATTOM Data Solutions. The April St Louis foreclosure rate was down 17.9% from the year before.
As the table below shows, over half the counties in the St Louis MSA saw an increase in foreclosure activity in April from the month before, all in the double-digits, however, with the exception of the city of St Louis, all of the larger counties saw a decline from the month before.
During the first quarter of this year, there were foreclosure filings on 1,948 properties in the St. Louis MSA, which equates to 1 foreclosure filing for every 51 housing units, according to the latest data from ATTOM Data Research. As the table below, which shows data for the 20-largest metro areas in the U.S., shows, this foreclosure rate puts St Louis at number 7 on the list in terms of foreclosure rate.
Jefferson County, with an estimated population of 221,577 during 2018, had 317 foreclosure filings during 2018, giving it the highest rate of foreclosure filings per capita, at 1 foreclosure filing for every 699 in population, of the all the Missouri counties with a population of 50,000 or greater. As the table below shows, the three Missouri counties with the highest foreclosure rate per capita are all located within the St Louis MSA and Boone County, in the Columia MSA, has the lowest foreclosure rate in the State.
Yesterday, I wrote an article about the number of foreclosures in St Louis during 2018 dropping to the lowest number in over 12 years, however, in spite of that good news, St Louis still has the 8th highest rate of foreclosure among the 20 largest metro areas in the U.S.
According to data just released by ATTOM Data Research, as the table below shows, during 2018 St Louis had a foreclosure filing for 1 of every 180 housing units. This rate puts St Louis at the 65th highest rate of the 219 MSA’s in the U.S. with a population of over 200,000 and at the 8th highest rate of the 20 largest MSA’s. Worth noting is St Louis barely made the list of 20 largest MSA’s coming in at 19th largest based upon population.
As evidence of just how much the St Louis housing market has improved since the housing bubble burst a little over a decade ago, as well as a testimony as to the strength of our economy, the number of St Lous homeowners thatlost their homes to foreclosure last year dropped to the lowest level in over 12 years.
As the tables below show, during 2018, 6,882 homeowners in the St Louis metro area received a notice of a foreclosure filing from their lender on their property, a decline of 6% from the prior year when 7,323 homeowners received a foreclosing filing notice. The number of foreclosure filings in St Loius during 2018 was down 68.3% from 2010 when the number of foreclosures in St Louis hit a record high with 21,741 homeowners receiving a foreclosure filing notice.
The number of St Louis homeowners losing their homes in foreclosure declined to a total of 700 foreclosure actions in the St Louis MSA, according to the latest report from ATTOM Research. Aprils foreclosure rate of 1 in every 1,768 housing units in the St Louis MSA is a decline of 22.82% from the rate a year ago and a decline of 9.68% from the foreclosure rate for March 2018.
As the table below illustrates, of the 15 counties in the St Louis MSA covered, all but three have seen a decline in foreclosure rates from a year ago (and all of those double-digit declines at that) and two-thirds of the counties saw a decline from the month before.
(We work hard on this and sure would appreciate a “Like”)[iframe http://www.facebook.com/plugins/like.php?href=https%3A%2F%2Fwww.facebook.com%2FStLouisRealEstateNews&send=false&layout=standard&width=50&show_faces=false&font&colorscheme=light&action=like&height=35&appId=537283152977556 100 35 ]
The real estate market in St Louis continues to improve and grow stronger, evidenced by the declining foreclosure rates being reported by ATTOM Data Solutions. For November 2017, there were 857 foreclosure actions taken on housing units within the St Louis MSA, a decline of 17.52% from the month before and a decline of 6.54% from a year ago.
St Louis MSA Foreclosure Rate – November 2017
(We work hard on this and sure would appreciate a “Like”)[iframe http://www.facebook.com/plugins/like.php?href=https%3A%2F%2Fwww.facebook.com%2FStLouisRealEstateNews&send=false&layout=standard&width=50&show_faces=false&font&colorscheme=light&action=like&height=35&appId=537283152977556 100 35 ]
Missouri Online Real Estate, Inc. 3636 South Geyer Road - Suite 100, St Louis, MO 63127 314-414-6000 - Licensed Real Estate Broker in Missouri
The owner and authors this site are providing the information on this web site for general informational purposes only and make no representations, warranties (expressed or implied) or guarantees of any kind whatsoever, as to the accuracy or completeness of any information on this site or of any information found by following any link on this site. Furthermore, the owner and authors of this site will not be liable in any manner whatsoever for any errors or omissions in information on this site, nor for the availability of this information. Additionally the owner and authors of this site will not be liable for for any losses, injuries or damages in any way from the display or use of this information or as the result of following external links displayed on this site, or by responding to advertisements displayed, or contained, on this site
In using this site, users acknowledge and agree that the information on this site does not constitute the provision of legal advice, tax advice, accounting services, investment advice, or professional consulting of any kind nor should it be construed as such. The information provided herein should not be used as a substitute for consultation with professional tax, accounting, legal, or other competent advisers. Before making any decision or taking any action on this information, you should consult a qualified professional adviser to whom you have provided all of the facts applicable to your particular situation or question. None of the tax information on this web site is intended to be used nor can it be used by any taxpayer, for the purpose of avoiding penalties that may be imposed on the taxpayer.
All of the information on this site is provided as is, with no assurance or guarantee of completeness, accuracy, or timeliness of the information, and without warranty of any kind, express or implied, including but not limited to warranties of performance, merchantability, and fitness for a particular purpose.
This site contains external links to other sites not owned or controlled by the owner of this site, therefore the owner of this site does not control or guarantee in any manner the accuracy or relevancy of any information obtained through following such links. Links contained on this site are for users convenience and users should exercise extreme caution when following links. Including a link on this site does not constitute an endorsement of the site linked to or any views or opinions expressed on the site, products or services offered on outside sites or the companies or organizations that own and operate outside sites.
This site may accept payment for advertising, for displaying advertisements, through affiliate relationships with companies or may receive referral fees or commissions from companies as a result of recommending or referring people to a website. This site may also accept free product samples, free services, gift cards or cash to review a product or service. All paid and sponsored content may not always be identified as such. Any product claim, quote or other representation about a product or service should be verified with the manufacturer or provider.
")

")