Not only has it become common today for homes to sell as soon as they hit the market but receiving offers from multiple buyers and at prices that equal or even exceed the asking price is common as well. While this is an illustration of Economics 101, the rule and supply and demand, when the demand exceeds the supply (such as in the housing market in many price ranges and areas), prices increase this can also be a reminder of times past when home prices rose quickly for several years, then retreated rather abruptly. The most recent example of this, and arguably the worst during my 40 years in the real estate business, was the housing bubble that burst in 2008 sending home prices into a downward trend that lasted about 3 years.
So, are we headed to another housing bubble?
My focus is primarily on the St Louis housing market so I will focus on that but I will point out what I see with regard home prices, St Louis has a better outlook than at the national level.
[xyz-ips snippet=”Homes-For-Sale-and-Listings-With-Virtual-Tours”]
Just how much have St Louis home prices increased lately?
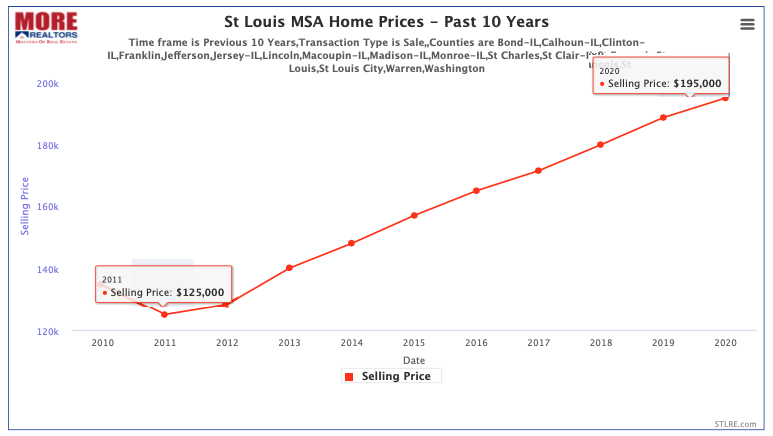
All real estate is very local, so many areas of St Louis have behaved differently than the overall St Louis area, and we have data to drill down to even the subdivision or neighborhood level for you but here I’m going to look at the St Louis area as a whole. The first thing I want to share is one of our charts below which shows the median price of homes sold in the St Louis MSA for the past 10 years. As the chart shows, the median home price in the St Louis MSA area hit a low of $125,000 in 2011 after declining the 3 prior years since the housing bubble burst and has since risen to $195,000, an increase of 56% in 9 years. At an average increase of about 6.2% per year, that’s higher than the historical norm for home prices (closer to 5%) but, remember, for the 3 years prior home prices had dropped.
St Louis MSA Sold Home Prices – Past 10 Years
(click on chart for live, interactive chart)
Are higher St Louis home prices causing a decrease in home sales?
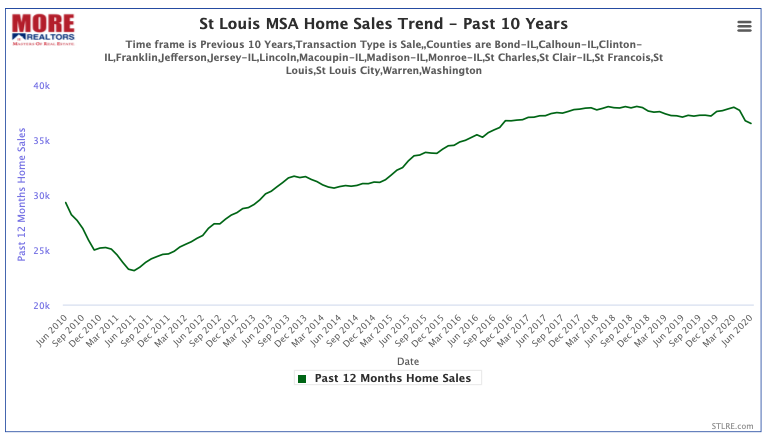
With the higher home prices one may become concerned that affordability will be an issue and drive some home buyers from the market which, if enough buyers are driven away, demand drops and thus perhaps home prices too. To explore this, first I looked at the home sales trend for the past 10 years. The chart below shows home sales in the St Louis MSA for 12-month periods going back 10 years. This way we can see trends and, as the chart shows, you can see the home sales trend has been pretty steady. Home sales pretty much peaked in 2019 which was to be expected after years of steady increases and, at the far right of the chart you’ll see a little downward dip but hat is pretty much the result of COVID-19 which cause a major slowdown in home sales in March and April, resulting in closings to drop in June, which is depicted on the chart.
St Louis MSA Home Sales Trend – Past 10 Years
(click on chart for live, interactive chart)
Leading indicators…”forecasting tools”..what they say.
Economists love “leading indicators”, data that gives an indication of where a market is headed before it heads there. I love them too, so much so, that our company developed proprietary software to crunch data and display it to help us see where things are headed. One such indicator is new contracts on listings which shows us market activity before traditional “home sales” data does since the latter is based upon closings which occur typically 6 weeks after the sale.
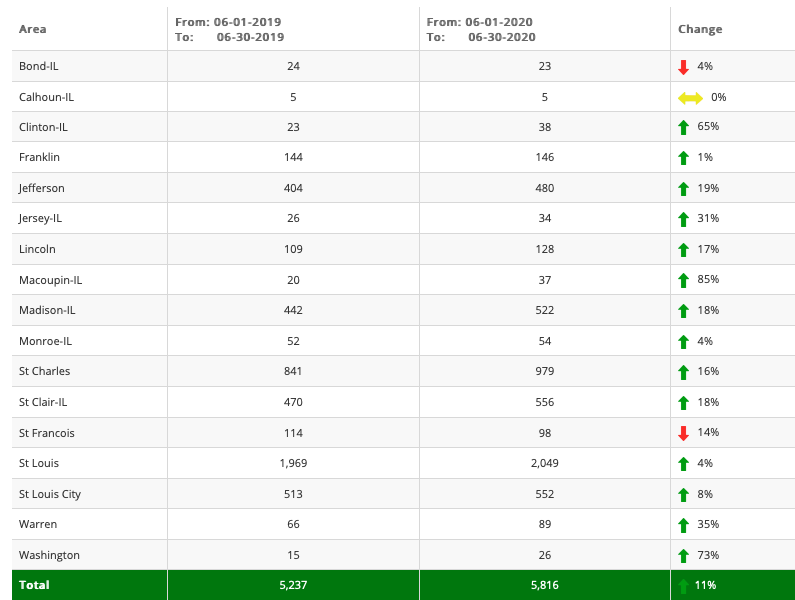
The table below shows the number of new contracts, or new sales, of existing listings that occurred in June compared with June of 2019. As the table shows, there was an 11% increase in new sales last month over a year ago so it doesn’t look like the demand is slowing down.
St Louis MSA – New Contracts – June 2020 vs June 2019
(click on table for current data)
Summary and how this chart helped me see the housing bubble burst over a year before it burst.
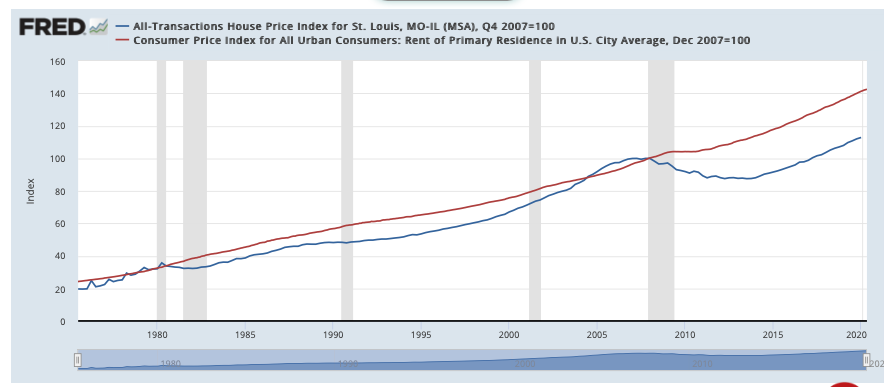
Based upon everything I’ve shared above, I don’t see anything that causes me to think that St Louis home prices have increased too rapidly nor risen to unsustainable levels. I also don’t see any weakening of the demand and have witnessed a very quick recovery from the impact COVID-19 had on the market. Finally, there is one last thing to look at though and that’s the relationship between home prices and rents. This is something that helped me predict, in October 2006 that we were soon going to see a major correction in home prices, we had to based upon the data. This article is already long enough so I won’t explain the theory behind it in detail, but in brief, residential rents are the “constant” as they always increase at a steady rate without much fluctuation. There must be some relationship between the cost of a home and what a similar home could be rented for so when we see the relationship between these two changes, we know something has to happen to bring them back in line. Since rents don’t fluctuate much, it’s the home prices that adjust either downward or upward to realign the cost of a home with the rental value.
This chart goes back to 1970 and you can see rent (the red line) is very steady in terms of trend and home prices (the blue line) fluctuate but, historically follow near the rent trend line. One exception is in the period starting around 2004 when home prices exceeded rents until the bubble burst in 2008. Then, home prices fell leaving a gap between home prices and rents that, even today, is still a much wider gap then historically normal. So, if anything, this chart may indicate St Louis home prices are too low, but it certainly doesn’t indicate they are too high.
St Louis Home Price Index vs CPI Index For Residential Rent In U.S. Cities
(click on chart for live, interactive chart)
[xyz-ips snippet=”Homes-For-Sale-and-Listings-With-Virtual-Tours”]


