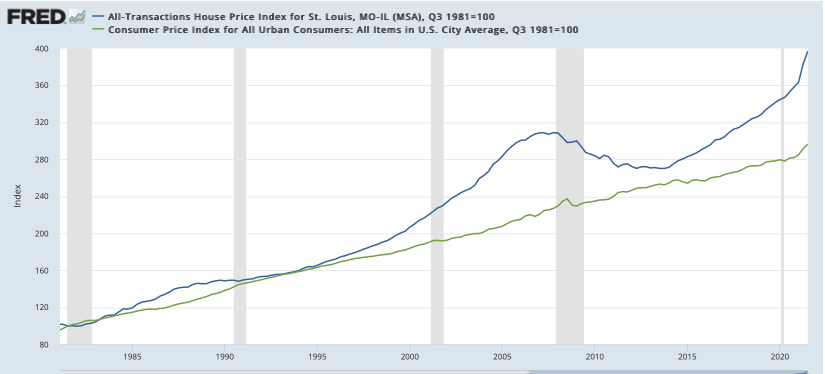
As you’ve probably heard by now, the most recent inflation news was not good. As the chart below illustrates, the Consumer Price Index (CPI) for all products in the U.S. (city average) for November 2021 was 303.4, an increase of 6.88% from a year ago when it was 284.1. This is the highest 12-month increase in inflation we have seen in over 39 years, since June 1982.
What effect will this record-setting increase in inflation have on home prices?
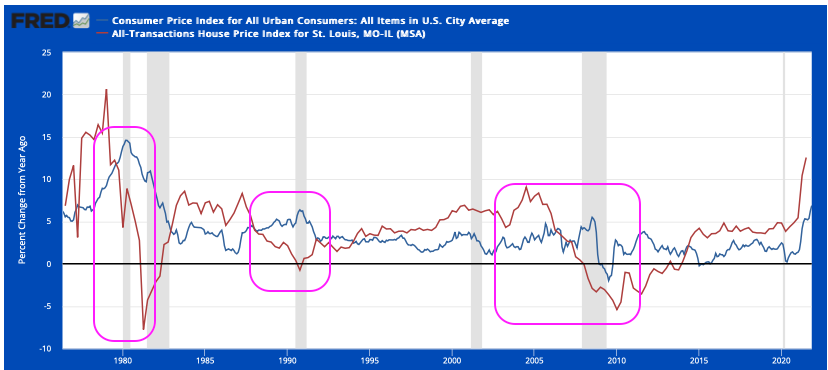
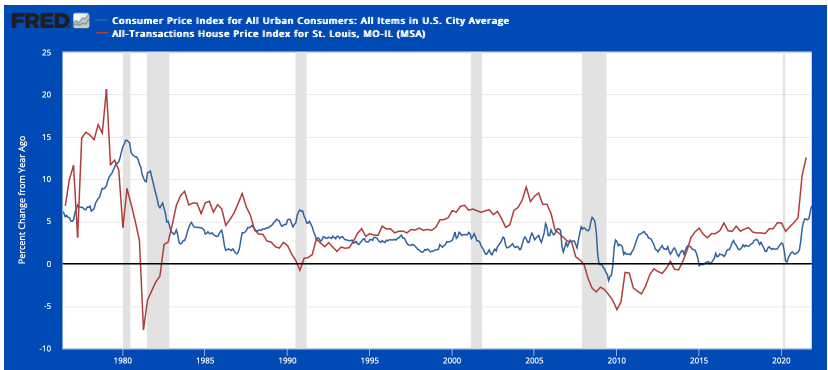
The second chart below depicts the percentage change in the inflation rate from a year ago (the blue line) as well as the percentage change in the St Louis home price index from a year ago (the red line). As you look at the chart and reference the marked-up one I have below it, you will see a pattern. Historically, when inflation rates increase significantly and consistently from a year ago, lower home prices follow. Will this happen this time as well? It’s hard to say right now as we still have an incredibly low supply of homes on the market, which tends to fuel higher prices, and we’ll need to see if the rise in inflation is sustained over the next few months. For the time being, I’ll make the prediction that in 2022 we will see, at a minimum, a flattening of home prices…so maybe not a decline, but a pause on the rate of increase. Time will tell.
[xyz-ips snippet=”Foreclosures-For-Sale-and-Homes-For-Sale”]
St Louis Home Prices vs Consumer Price Index (CPI)
(click on chart for live, interactive chart)
12-Month % Change in St Louis Home Prices vs 12-Month % Change in Consumer Price Index (CPI)
(click on chart for live, interactive chart)

[xyz-ips snippet=”Foreclosures-For-Sale-and-Homes-For-Sale”]


