Comments are closed.
|
|||
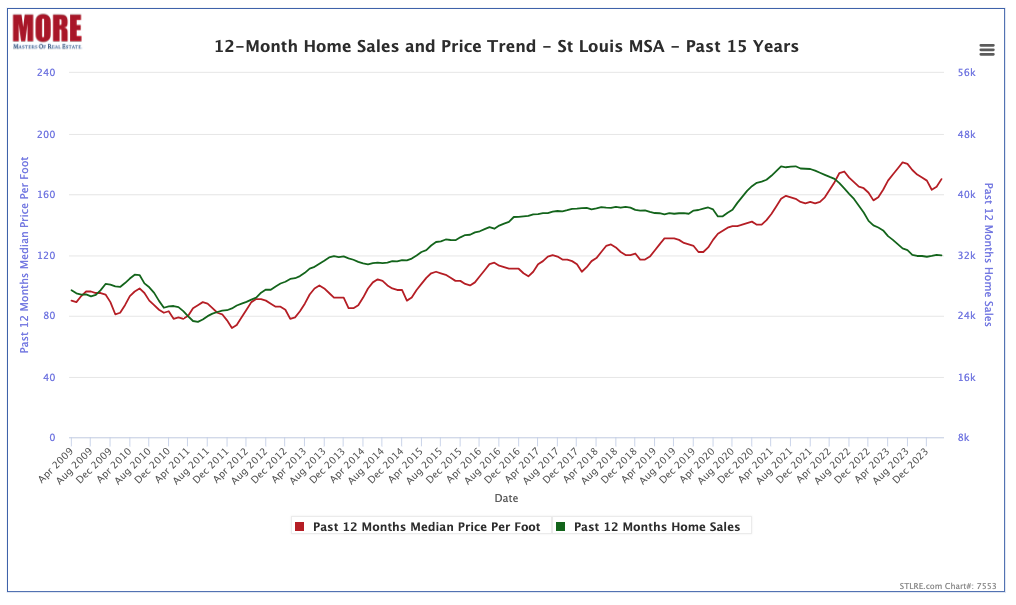
St. Louis Area Home Sales Stabilize to 2015 LevelsThe St. Louis metro area’s real estate market has demonstrated significant fluctuations in home sales over the past fifteen years, revealing interesting trends for both homebuyers and sellers. Analysis of the 12-month home sales data chart, exclusively available from MORE, REALTORS®, illustrates a series of peaks and troughs that correspond closely with various economic factors impacting the region. St Louis home sales fell to the lowest point during the 15-year period in June 2011 when the 12-month period had 23,194 sales. Since hitting that low home sales have steadily increased until the 12-month trend hit 43,689 sales for the period ended September 2021. Since hitting that high, the sales trend has steadily decreased, while interest rates have increased at the same time, and appears to have stabilized around the 32,000 homes mark or at least has stayed at the level for the past 8 months. The median price of homes sold during the same period went from $97 per foot when sales hit their low in June 2011 to $170 per foot in March 2024 reflecting an annual rate of increase of 6.43%.
|
|||
|
St Louis Real Estate Search® St Louis Home Values St. Louis Real Estate News Contact Us Copyright © 2026 Missouri Online Real Estate, Inc. - All Rights Reserved St Louis Real Estate News is a Trademark of Missouri Online Real Estate, Inc. Missouri Online Real Estate, Inc. 3636 South Geyer Road - Suite 100, St Louis, MO 63127 314-414-6000 - Licensed Real Estate Broker in Missouri The owner and authors this site are providing the information on this web site for general informational purposes only and make no representations, warranties (expressed or implied) or guarantees of any kind whatsoever, as to the accuracy or completeness of any information on this site or of any information found by following any link on this site. Furthermore, the owner and authors of this site will not be liable in any manner whatsoever for any errors or omissions in information on this site, nor for the availability of this information. Additionally the owner and authors of this site will not be liable for for any losses, injuries or damages in any way from the display or use of this information or as the result of following external links displayed on this site, or by responding to advertisements displayed, or contained, on this site
In using this site, users acknowledge and agree that the information on this site does not constitute the provision of legal advice, tax advice, accounting services, investment advice, or professional consulting of any kind nor should it be construed as such. The information provided herein should not be used as a substitute for consultation with professional tax, accounting, legal, or other competent advisers. Before making any decision or taking any action on this information, you should consult a qualified professional adviser to whom you have provided all of the facts applicable to your particular situation or question. None of the tax information on this web site is intended to be used nor can it be used by any taxpayer, for the purpose of avoiding penalties that may be imposed on the taxpayer. |
|||


