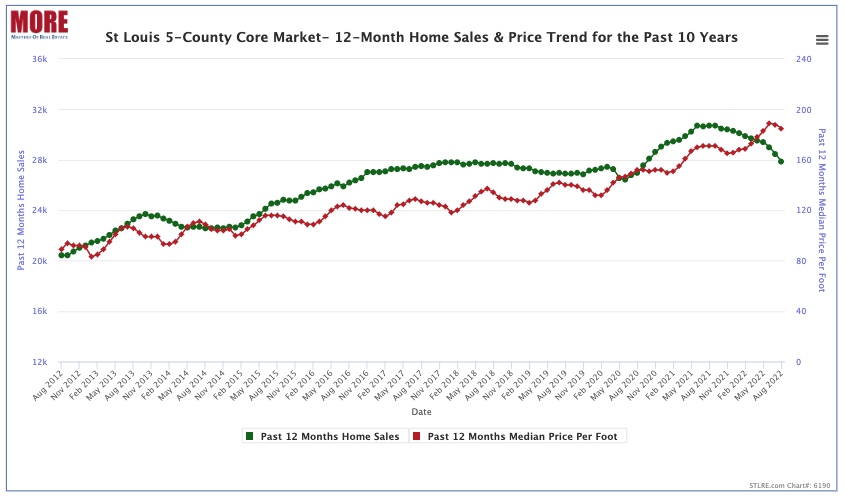
The 12-month home sales trend in the St Louis 5-county core market declined in August to 27,840 homes sold in the 5-county area during the prior 12-months, marking the lowest 12-month sales number since September 2020. As the chart below illustrates, the 12-month home sales trend in St Louis has declined now for 11-months in a row landing just slightly higher than the 12-months sales of 27,573 for September 2020.
The St Louis home sales trend is still higher than any period after August 2006 and prior to September 2020…
At the current level, the St Louis home sales trend is slightly above the trends prior to September 2020 going back to the peak of the bubble in August 2006 when there were 27,974 homes sale in the prior 12-months. However, if it declines further will be in the range of the years 2016 through mid-2020.
St Louis Home Price Trend Outpacing Sales…
The chart below also shows the median price per foot for homes sold during the prior 12-month period. As it shows, the home price trend has continued to increase while the sales trend has been declining however that changed in June when the price trend started declining. If you look back t prior years you will see that is earlier than when the normal seasonal adjustment comes so it is likely indicative of the market.
St Louis 5-County Core Market – 12-Month Home Sales & Price Trends Chart
(click on chart for live, interactive chart)


