For the 12-month period ended January 31, 2023, there were 24,993 homes sold in the St Louis 5-county core market which, as the STL Market Report below (available exclusively from MORE, REALTORS®) shows, is nearly a 17% decline in home sales from the the prior 12-month period when there were over 30,000 homes sold. The median price of homes sold during the most recent 12-month period was $266,500, an increase of 6.6% from the prior 12-month period.
St Louis home sales trend falling fast….
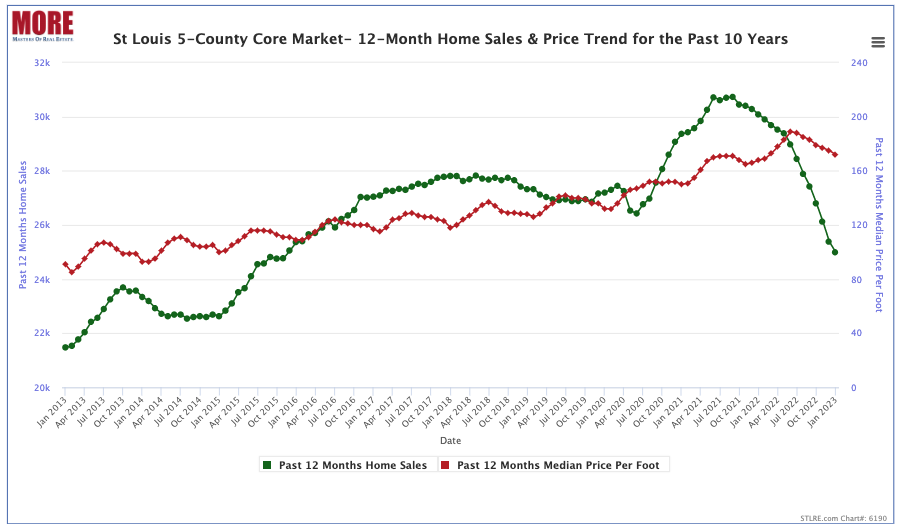
Below the market report is a STL Market Chart showing (also available exclusively from MORE, REALTORS®) the 12-month home sales and home price trend for the St Louis 5-County core market for the past 10 years. The green line on the chart depicts the 12-month sales trend for each month for the past 10-years revealing a decline in the St Louis home sales trend for the past 16-months. The 12-month home sales trend in St Louis is now at the lowest level (24,993 homes) since November 2015 when 12-month St Louis home sales were are 24,772.
St Louis home price trend falling as well….
The red line on the chart depicts the median price per square foot St Louis homes sold at for the 12-month period ending in the month shown. Home prices are seasonal and fluctuate every year, through good markets and bad markets, peaking in early summer and hitting a low in during winter. However, the decline this year, from the peak in June at $189/foot to $172 in January (nearly a 9% decline) is a much larger decline than last year when were was just a 1.7% decline in price during the same period. In 2021 the price decline during the same period was just 1.3% .
STL Market Report – St Louis 5-County Core Market
(click on report for live, complete report)
St Louis 5-County Core Market – 12-Month Home Sales & Price Trend – Past 10 years
(click on chart for live, interactive chart)


