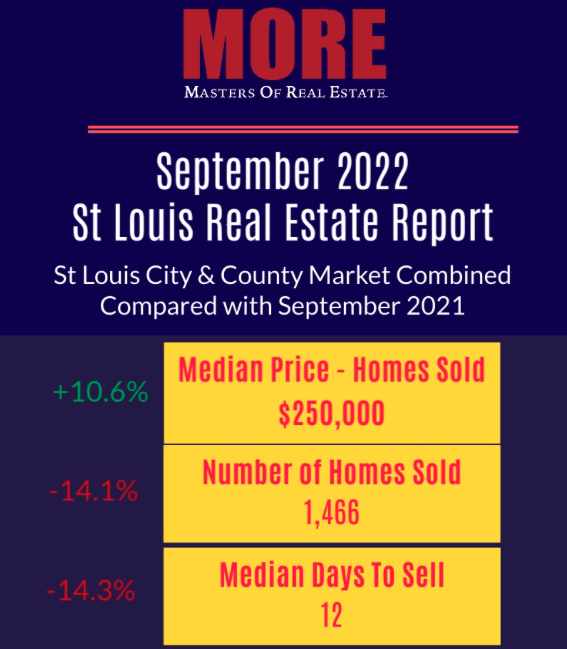
Below is our St Louis Real Estate Market Report for September 2022 for the City and County of St Louis combined. You can access the full infographic, containing data for St Charles, Jefferson and Franklin Counties as well by clicking on the image below. Worth noting and remembering is not all data is created equally nor is all of what you see reported accurate. Given the challenging and rapidly changing economic times we are in which are having an direct impact on the St Louis housing and real estate market, now, almost more than ever, you need to be sure the data you base your real estate decisions on is accurate and the agents you are trusting to get you through the process have the knowledge, information and accurate data they need to do so. At MORE, REALTORS® we have developed proprietary software which uses the database we have created from the REALTOR® MLS (MARIS) to produce what we believe is the most accurate and relevant data and reports for the St Louis residential real estate market. For example, currently, there are other sources reporting (and many, many real estate agents sharing the information without verifying) that the median price for homes sold in the City and County of St Louis during September was over 6% higher than our data shown below. Think what an impact that could have on you if you base your decision to buy or sell a home on pricing data that is over stating the value.
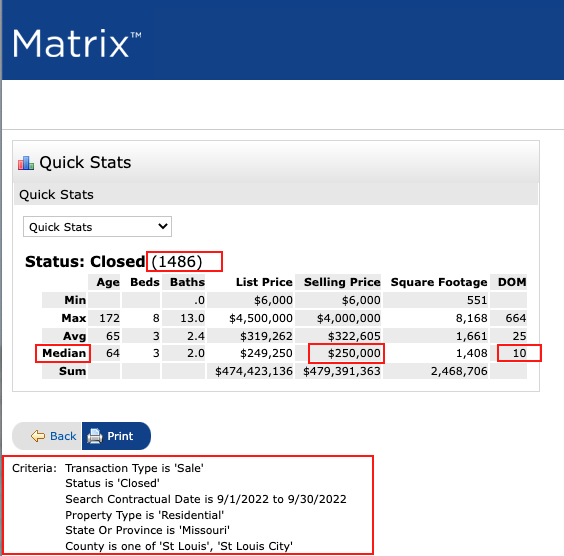
Oh, how do we know we’re right? We have proof, straight from the MLS, see the image below our infographic which is a screen shot straight from the MLS showing date for closed sales during the month of September in the city and county of St Louis. You’ll find that the median price from the MLS is $250,000, the same as our data computed, the number of sales is a little higher in the MLS (20 or just over 1%) because while about 99% of sales are sent out in “feeds” to broker websites etc (including Zillow and Realtor.com) there are a few listings that are not and the DOM (days on market, or days to sell) at 10 is very close to our 12 (this is due to us using a slightly different method to compute median for the data).
St Louis Real Estate Report for September 2022

Our Proof.


