Yesterday, I had lunch with a friend in the industry who expressed his concern that the Jefferson County real estate market was cooling off a little and questioned the possibility a market correction. I referenced the article I wrote last week in which I explored the possibility of a market correction in St Louis and, based upon the data we have, came to the conclusion there wasn’t anything to be alarmed about at this time. However, I had looked at the 5 counties that make up the St Louis core market as a whole (which included Jefferson County) but did not look at the counties individually.
Therefore, this morning I drilled down in our data to look only at the Jefferson County real estate market, including home sales, inventory of homes for sale and home prices in Jefferson County to determine if there were indicators of a market correction looming in the near future.
Is a market correction coming for Jefferson County?
The short answer is yes and probably. Remember, all real estate is local, so the real estate market can vary signficantly within a metro area, a county, or even a city. This is why it is vital to have current, accurate market information (why we have spent several years developing our own software) and a real estate agent with access to the data, that can interpret it and apply it to their clients situation (which is why we have hand picked some of the best in the industry to be in our firm, MORE, REALTORS).
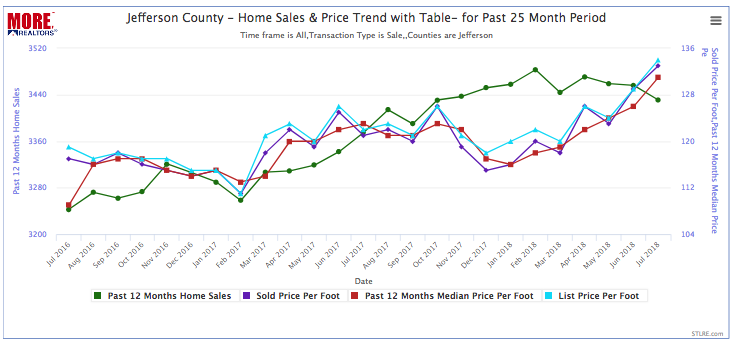
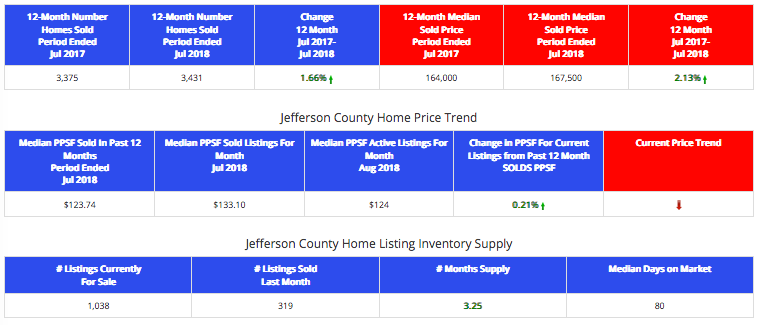
I wasn’t being funny with my answer, I just think the Jefferson County real estate market varies greatly by location so my answer is different for different parts of the county. First off, for Jeffeson County as a whole, as the first chart and first market report below show, the overall market in Jefferson County is pretty healthy currenlty. During the past 12 months, home prices increased about 1.6% and sales increased a little over 2% from the prior 12 month period and there is currently a 3.25 month inventory of homes for sale in Jefferson County. However, when you look at our trend chart, you will see the 12-month home sales trend for Jefferson County (the green line) is trending downward while list prices are trending upward. Everything looks ok right now but I would say there will probably be a little market correction in Jefferson County in the near future.
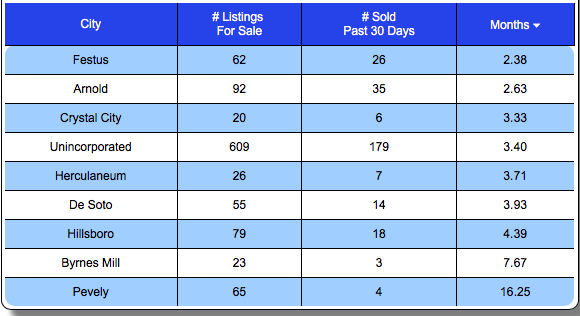
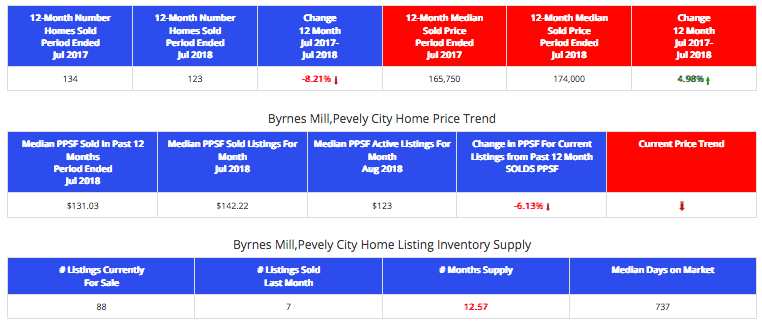
The third illustration below is a table showing the currently inventory of homes for sale for the cities in Jefferson County. This is where you can really see how much the market varies in Jefferson County. At the top of the list are Arnold and Festus, both with under a 3 month supply of homes for sale and at the other end of the list are Byrnes Mill and Pevely with over 7 months and 16 months, respectively, of inventory. Our market report reveals that, during the 12-month period ended July 31, 2018, home sales in Byrnes Mill and Pevely declined over 8% from the prior 12-month period but home prices increased nearly 5% during the same period
Byrnes Mill and Pevely are a yes..
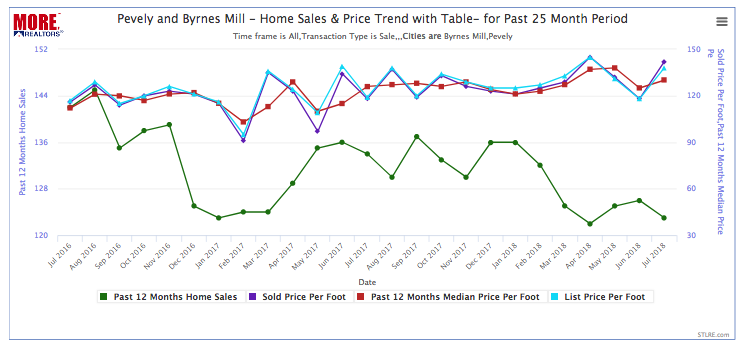
The bottom chart and market report below are for Byrnes Mill and Pevely and both paint a not so pretty picture of the market. First, on the sales trend chart, you can see the home slaes trend (green line) in Brynes Mill and Pevely has been declining for the better part of this year and while list prices dipped slightly in June, they jumped again in July. The report also reveals that this correction is already taking place with the median price per foot for active listings in August coming in at $123, a decline of 6% from the price per foot of homes sold in the prior 12 month period. So, the good news is, the correction is already underway, now the question is will home prices need to fall further to balance out the market but it will take time to tell.
[xyz-ips snippet=”All-Solds—Even-Jefferson-and-Franklin”]
Jefferson County Home Price and Sales Trend Chart
(click on the chart to see the live, interactive chart)
Jefferson County Market Report
(click on the table to see the live report)
Jefferson County Active Listing Inventory
(click on the table to see the live report)
Pevely and Byrnes Mill Home Price and Sales Trend Chart
(click on the chart to see the live, interactive chart)
Pevely and Byrnes Mill Market Report
(click on the chart to see the live report)
