The US Census Bureau recently released “Mover Rate” data which showed who moves, how frequently, the demographics of those who have moved as well as the geography of where they move. While they don’t have the data published at the city or county level, I did pull the data for here in the Midwest Region of the country and have compiled some of the more interesting tidbits in tables at the bottom of this article.
Here are highlights from the Mover Rate report from the Census Bureau:
- Overall, for the U.S., the rate at which renters moved during 2017, was at a historic low of 21.7 percent.
- The Northeast region of the U.S. has the lowest mover rate (8.3%), with the other 3 regions (Midwest, West, and South) all being fairly consistent with one another with rates of 11.4%, 11.5% and 11.8% respectively.
Midwest region highlights (see tables below for more extensive data):
- Just over 11% of the population moved during the past year
- Of those that moved, nearly 62% stayed in the same county, 23% moved to a different county but the same state making a total of nearly 85% of movers relocating within the state.
- Just under 2% moved abroad.
Midwest Region Mover Data – 2016-2017

Age of Midwesterners that moved – 2016-2017:
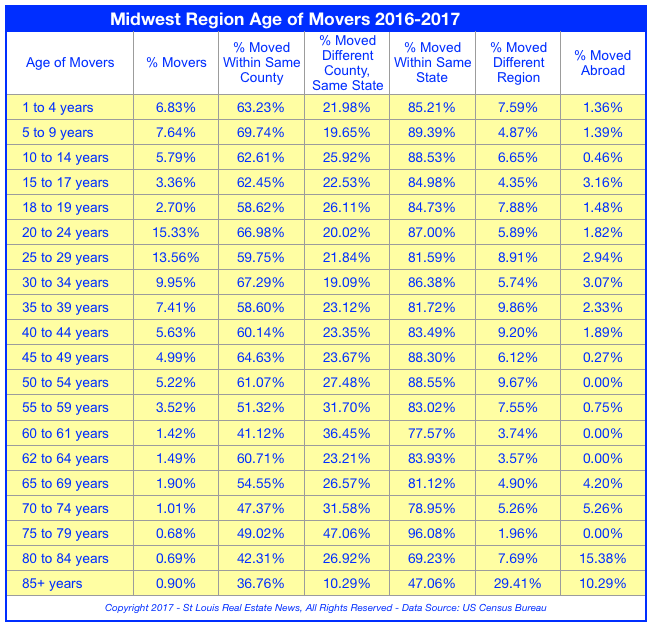
- The largest age group of people that moved was 20-24 (15.33%) followed by 25-29 (13.56%)
- Up to the age of 60, all age groups saw the majority move within the same county. Of the 7 age group classifications at 60 or above, only 2 saw the majority stay in the same county.
- The supermajority of all age groups moved within the same state in the Midwest with the only exception being the 85+-year-old group.
- Interestingly, and in spite of all the reports that there isn’t enough to keep millennials here, 80%+ moved within the same state.
Midwest Region Age of Movers – 2016-2017

Demographics of Midwesterners that moved – 2016-2017:
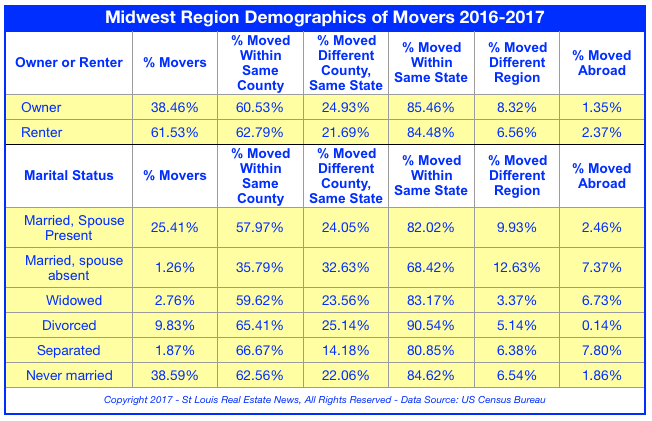
- Nearly two-thirds of the people that moved (61.53%) were renters.
- Singles made up the largest group of movers with nearly 39% of the movers in the Midwest being single, followed by Married with spouse present at over 25%.
Midwest Region Demographics of Movers – 2016-2017


