St Louis flipped homes accounted for 6.6% of home sales in the St Louis MSA during the 3rd quarter of 2017, the lowest level since the 3rd quarter of 2016 when flips made up 6.3% of the St Louis home sales. For the purposes of this report, a “flip” was defined as a property that was sold in an arms-length sale for the second time within a 12-month period.
Slow times are good flip times…
As the table below shows, with very few exceptions, for the 17 year period covered in the table, home flips have accounted for a larger percentage of the overall home sales in St Louis during the slow-selling seasons, the 1st and 4th quarters. This makes sense as lenders are more apt to make deals toward the end of the year to get foreclosures off the books before closing out the year.
Opportunities to flip homes in St Louis on the decline…
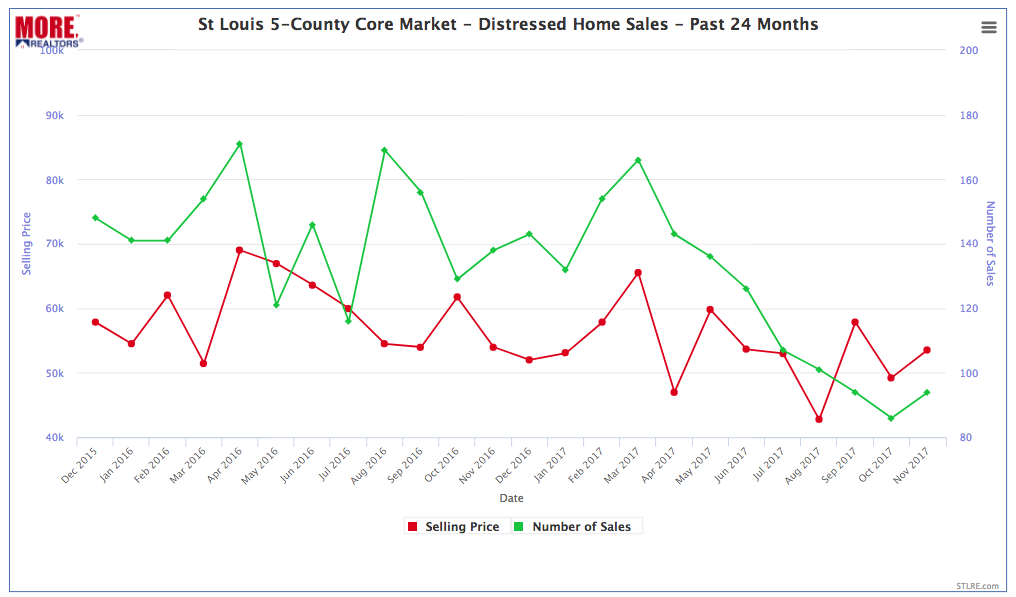
As our chart below the table shows, the number of distressed home sales (foreclosures, short sales, and bank-owned property) in the St Louis area has steadily declined during the past 2 years as the economy, including the housing market, continues to improve.
Search St Louis Homes For Sale HERE
See ALL Homes That Will Be Open In St Louis This Weekend
Want to flip property? Check out my video on how to buy foreclosures here.
Home Flips in St Louis 2000-2017 – St Louis House Flipping

St Louis 5-County Core Market – Distressed Home Sales – Past 24 Months
(Click on chart for live chart with current data)


