The five counties I refer to as the “St Louis Core Market“, which include the city of St Louis and counties of St Louis, St Charles, Jefferson and Franklin, account for over 90% of the home sales in the 9 Missouri Counties that are part of the St Louis MSA. This is why I typically focus on those five counties when reporting real estate market stats as they give the “big picture” view of the St Louis market but in a more accurate way than the St Louis MSA stats.
The counties making up the St Louis core market vary significantly in everything from socioeconomics and demographics to housing style, quality of public schools and home prices. As a result, the counties respond somewhat differently to market conditions, whether good or bad. To show how they compare, I produced a chart depicting home sales and price trends for the past 3 years. Which county fared the best over the past few years depends on which market statistic we rank them on.
Franklin County is the clear winner for home sales trend….
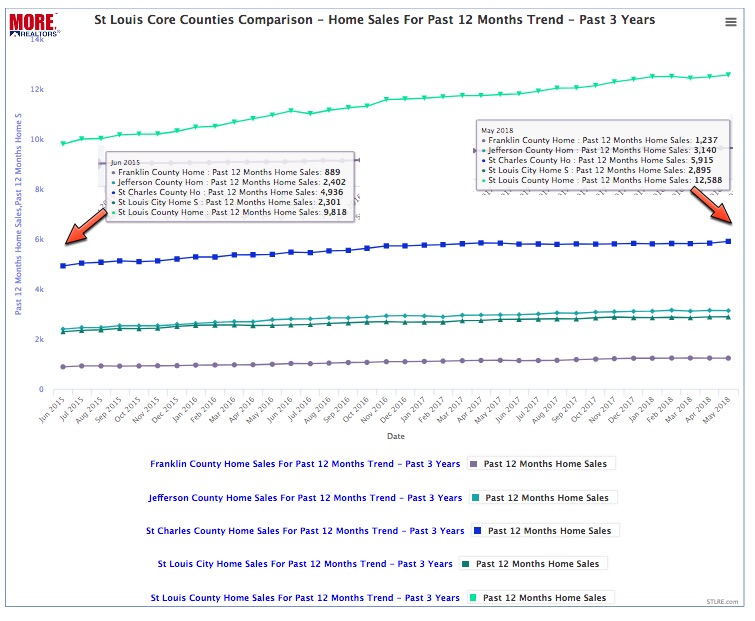
As the first chart below illustrates, the home sales trend for Franklin County has been the best, with a 39% increase over the past 3 years. For the 12-month period ended June 2015 there were 889 homes sold in Franklin County and for the 12-month period ended May 2018, there were 1237 homes sold.
St Louis City and St Charles County are at the top for home price appreciation…
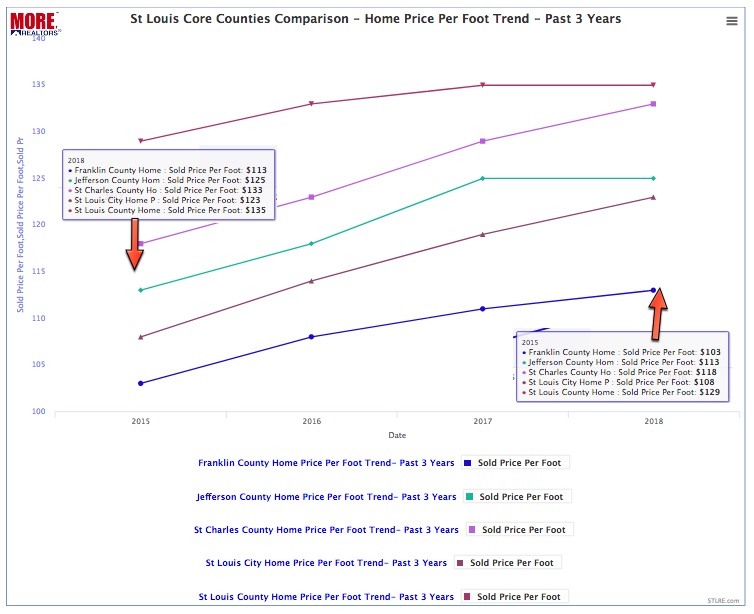
The bottom chart reflects the median price per foot for the homes sold in each county and shows that, over the 3-year period, the city of St Louis had the highest increase in home prices at 13.9% followed by St Charles County with a 12.7% increase. Interestingly enough, Franklin County, with the largest increase in home sales, had the second-lowest increase in home prices during the period.
St Louis Core Counties Comparison – Home Sales Trend – Past 3 Years
Click on chart to see the current chart with “live” data
St Louis Core Counties Comparison – Home Price Appreciation – Past 3 Years
Click on chart to see the current chart with “live” data


