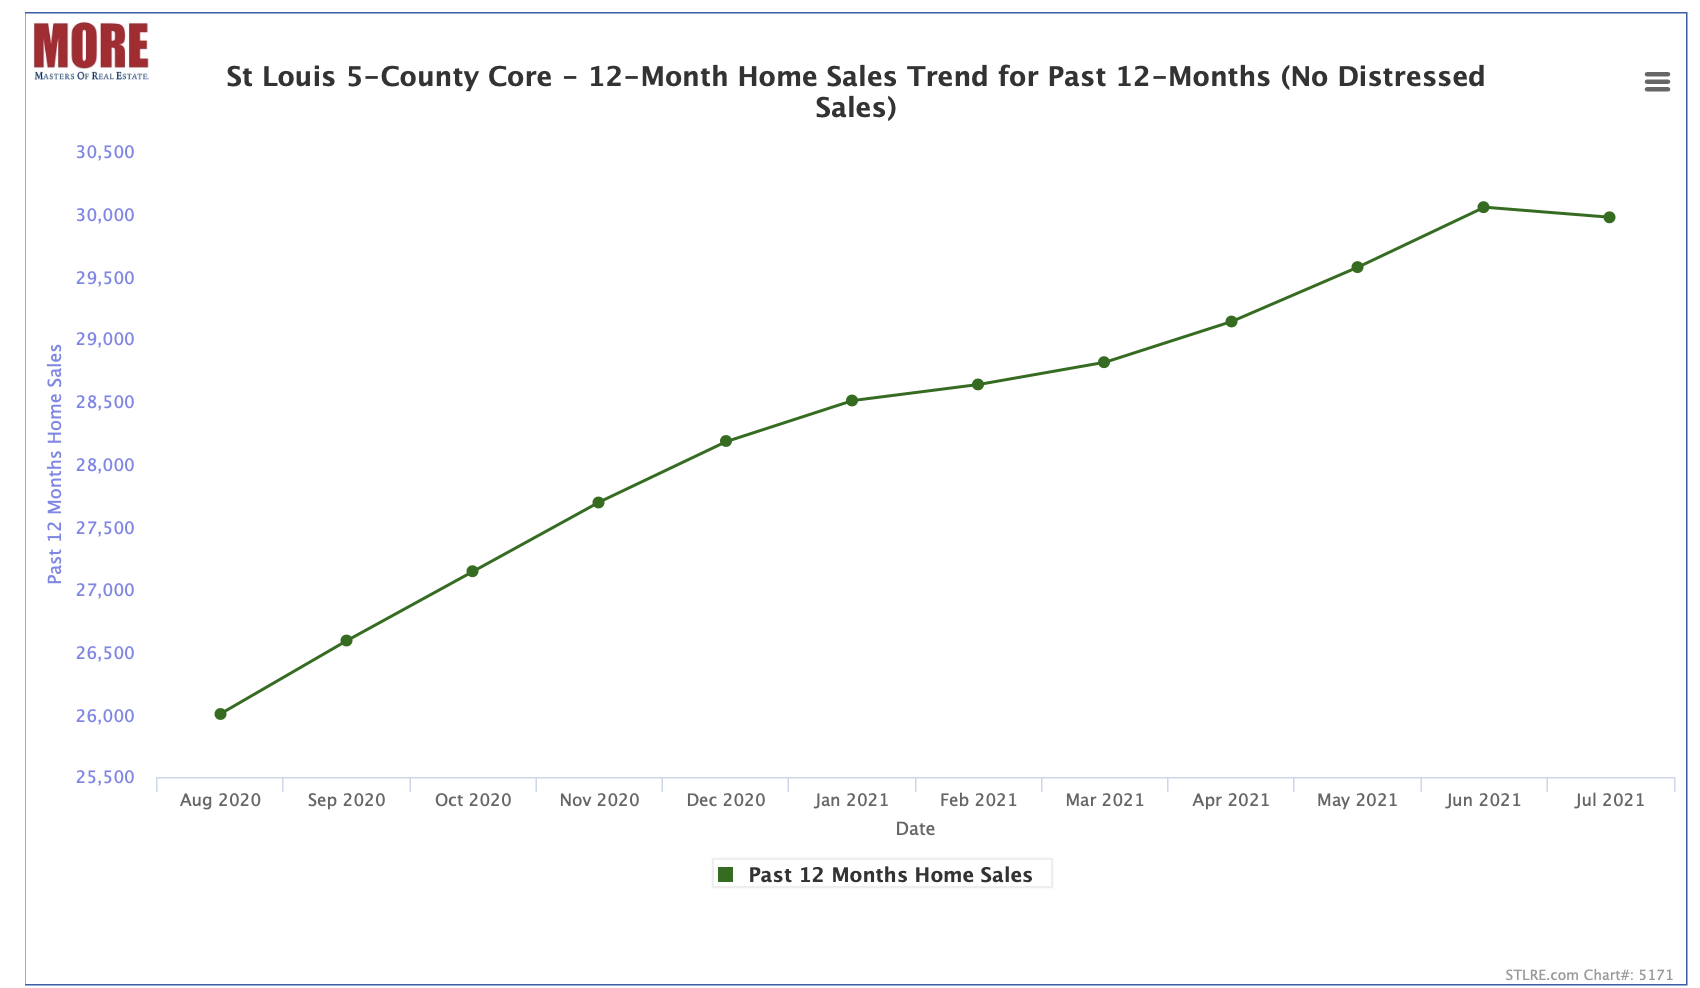
There has been talk of “the market slowing down” and while there hasn’t been a lot of data to support that, we did see the sales trend slow slightly in July. As the home sales trend chart below shows, exclusively available from MORE, REALTORS®, the home sales trend for the 12-month period ending has increased every month of this year over the prior month through June. For the 12-month period ending in June, there were 30,055 homes sold marking the highest record since we’ve been tracking the data, however, for the 12-month period ending in July home sales decreased slightly to 29,974 homes.
More new listings than new sales…
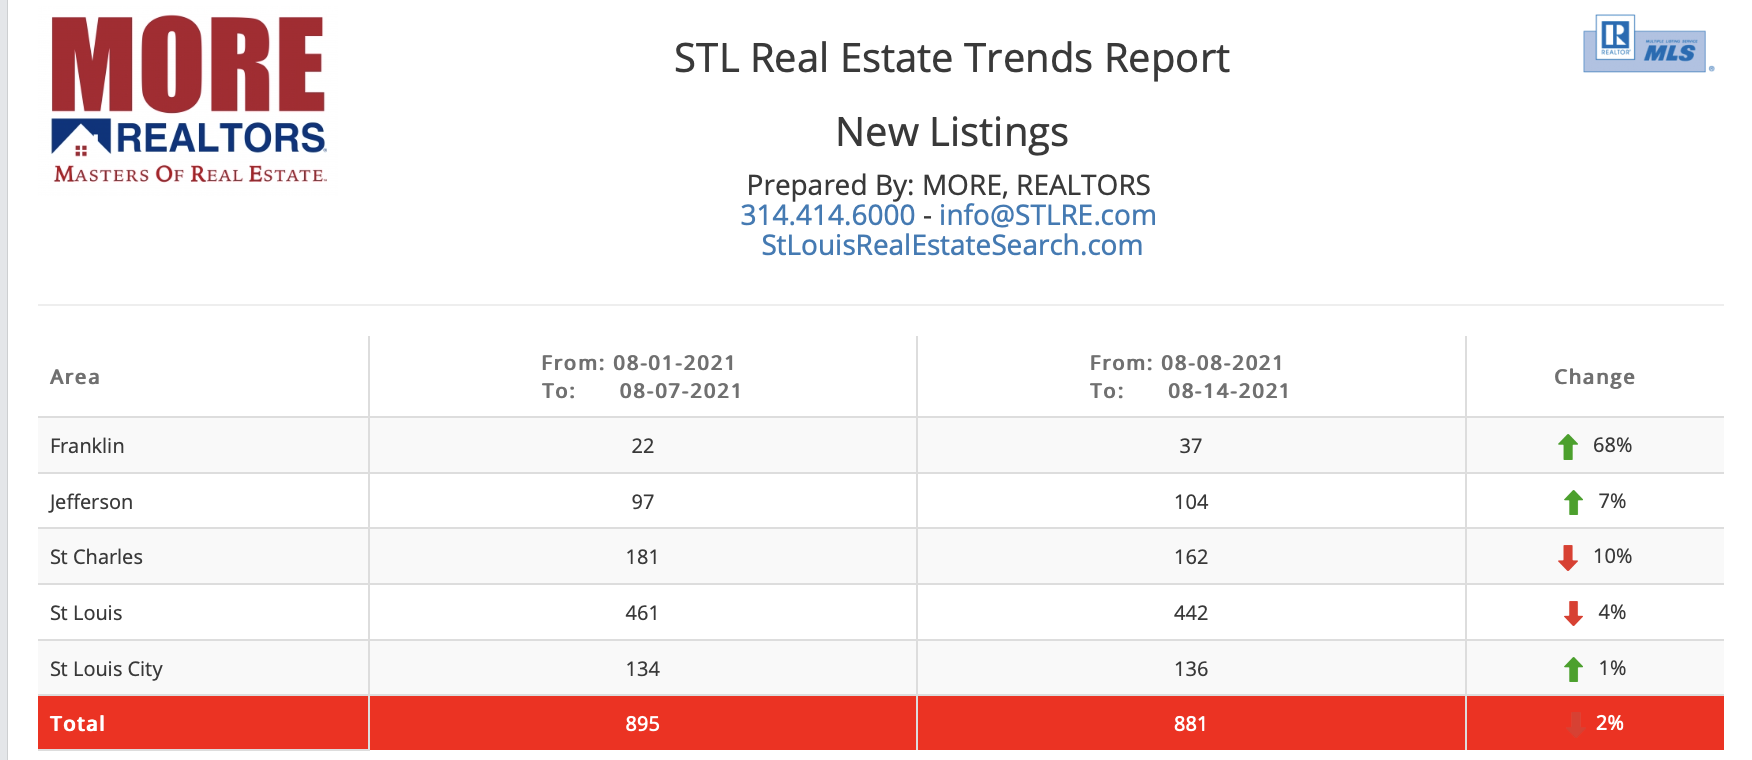
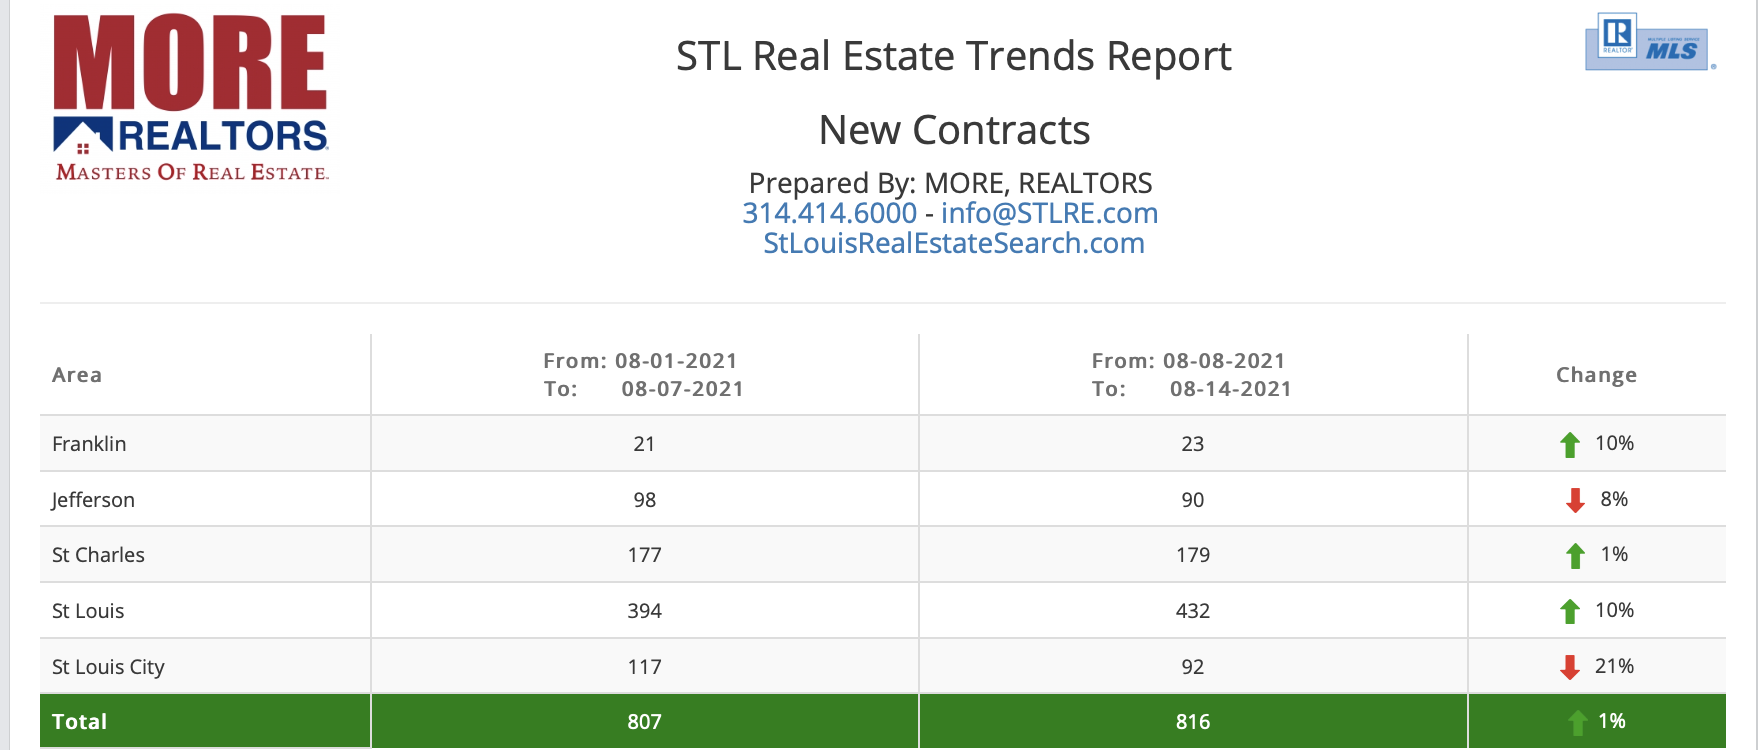
A change I’ve also noticed lately is that the number of new listings hiring the St Louis market is outpacing the number of new sales, a reversal of the trend we saw until recently. As the STL Trends Reports below show, there were 881 new listings in the most recent week and 816 new sales. For the prior week, the trend was the same with 895 new listings and 807 new sales.
[xyz-ips snippet=”Homes-For-Sale”]
12-Month Home Sales Trend – St Louis 5-County Core Market (no distressed sales) – Past 25 Months
(click on chart for live, interactive chart)
STL Real Estate Trends Report – New Listings
(click on report for latest report)
STL Real Estate Trends Report – New Sales Contracts
(click on report for latest report)
[xyz-ips snippet=”Homes-For-Sale”]


