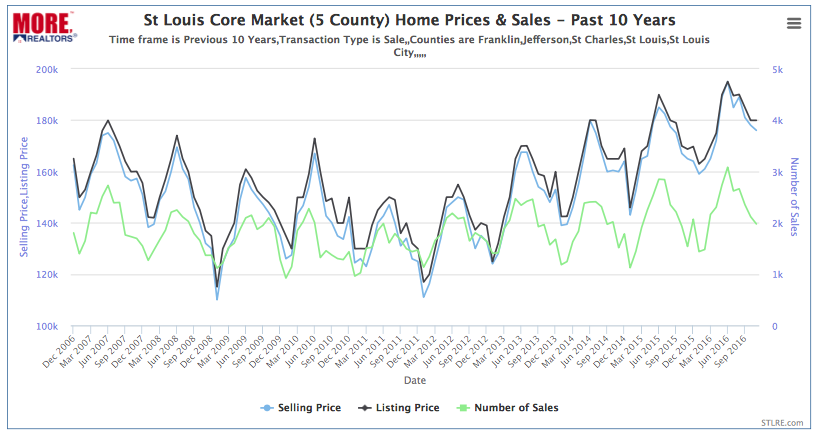
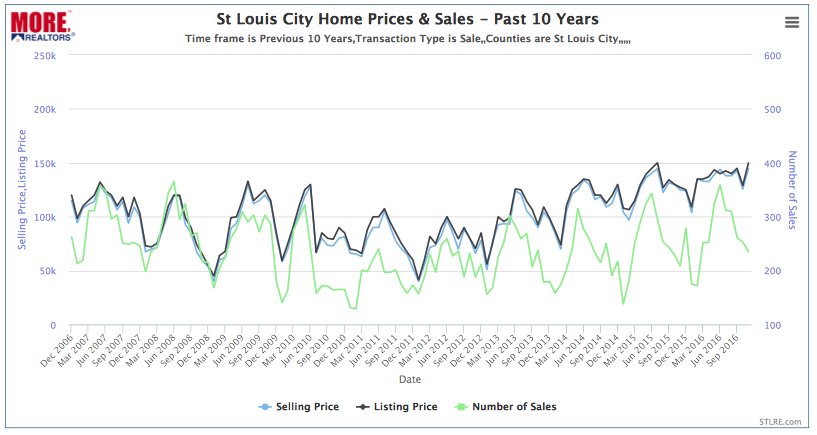
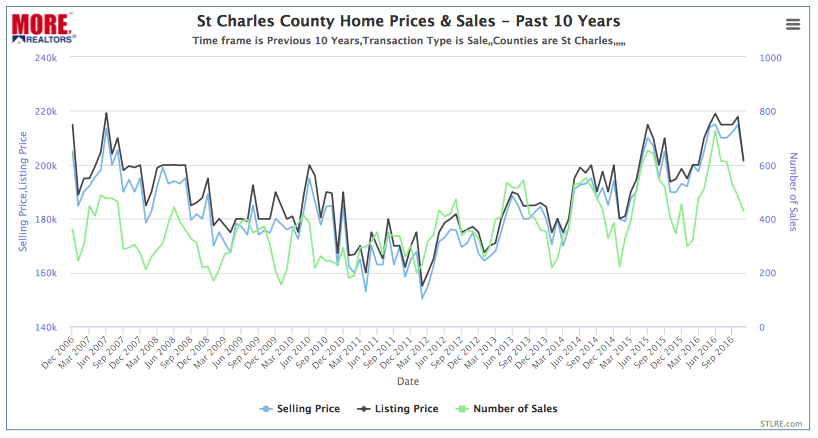
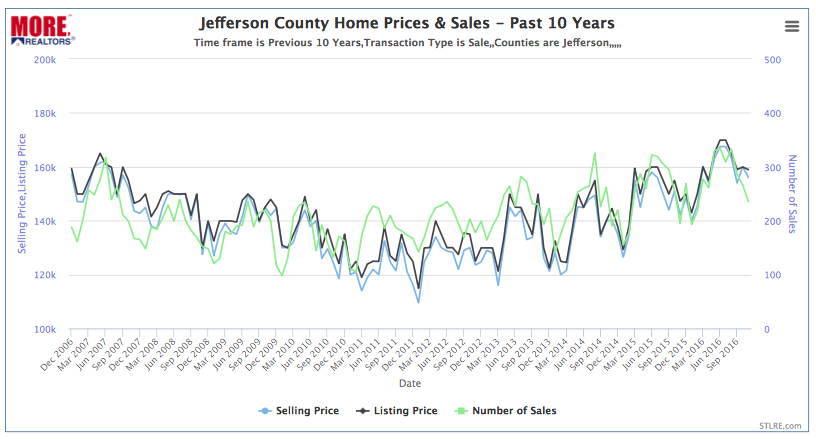
Home prices in St Louis, like most places in the country, peaked around 2007 at the height of the bubble, then, when the housing bubble burst in 2008, home prices began falling and didn’t hit the post bubble bottom until around late 2011 or early 2012 in most areas. Since hitting bottom, home prices throughout the St Louis area have recovered not only regaining what was lost after the bubble burst, but, in most cases, rising back above the peak levels from the height of the bubble nearly 10 years ago.
Where are home prices today in relation to the bubble?
Below I have 10-year charts for the St Louis MSA, the St Louis Core Market (the 5 major Missouri counties that make up the St Louis market) as well as the 5 major St Louis area counties individually, showing home sales, listing prices and sold prices for the past 10 years. As the charts show, home prices in all counties have fully recovered home values lost when the bubble burst and, with the exception of St Charles County and Jefferson County, all have returned to levels above the peak during the bubble in 2007. St Charles County and Jefferson County home prices are teetering around 2007 levels. If you click on the charts you will go to our live charts and can put your mouse over the chart to see actual home prices for each period.
Search St Louis Homes For Sale HERE
See ALL Homes That Will Be Open In St Louis This Weekend
Coming Soon Listings – Be The First!
St Louis MSA Home Prices & Sales – Past 10 Years
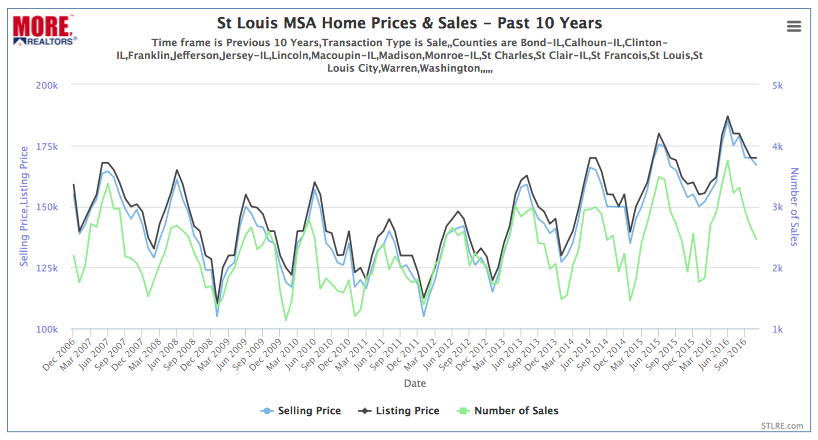
Copyright 2016 – MORE, REALTORS – All Rights Reserved
(click on chart to go to live chart)
St Louis Core Market Home Prices & Sales – Past 10 Years
Copyright 2016 – MORE, REALTORS – All Rights Reserved
(click on chart to go to live chart)
St Louis County Home Prices & Sales – Past 10 Years
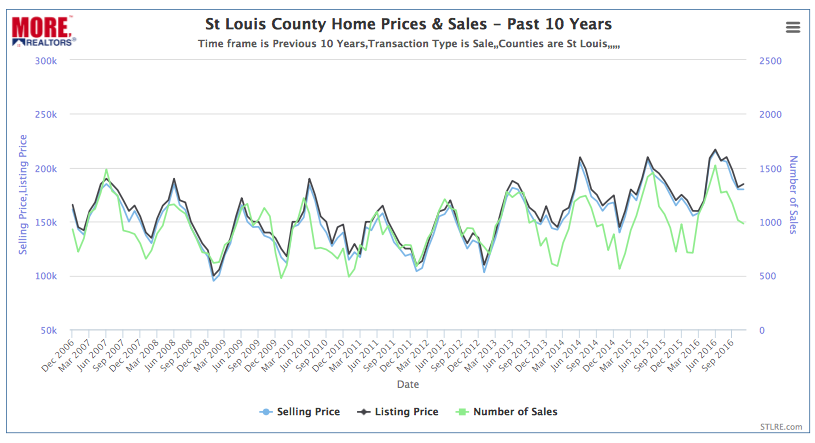
Copyright 2016 – MORE, REALTORS – All Rights Reserved
(click on chart to go to live chart)
St Louis City Home Prices & Sales – Past 10 Years
Copyright 2016 – MORE, REALTORS – All Rights Reserved
(click on chart to go to live chart)
St Charles County Home Prices & Sales – Past 10 Years
Copyright 2016 – MORE, REALTORS – All Rights Reserved
(click on chart to go to live chart)
Franklin County Home Prices & Sales – Past 10 Years
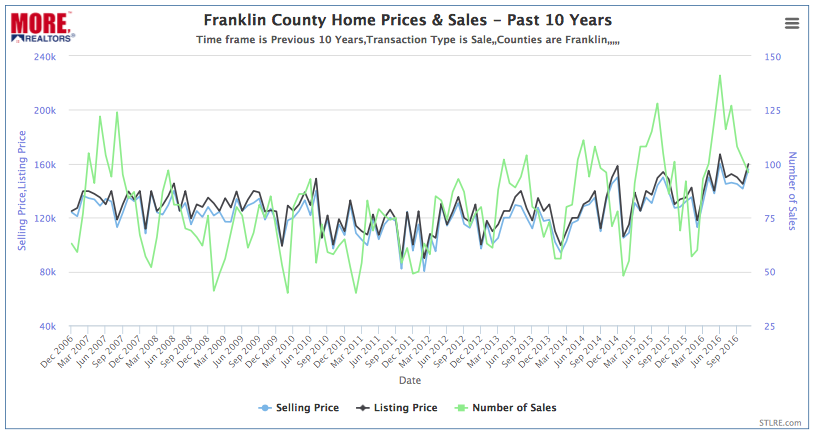
Copyright 2016 – MORE, REALTORS – All Rights Reserved
(click on chart to go to live chart)
Jefferson County Home Prices & Sales – Past 10 Years
Copyright 2016 – MORE, REALTORS – All Rights Reserved
(click on chart to go to live chart)
