I think just about everyone that is trying to buy or sell a home in St Louis or even thinking about it, is well aware that we have been in a strong real estate market here in St Louis for some time now. The St Louis real estate market has favored sellers for the past several years largely due to a low supply of homes for sale and continuing demand by home buyers. The question I’m often asked though, especially right now with so much going on in our country right now that could impact the economy (COVID-19 and the Presidential election are the two biggies) is “will the strong home sale in St Louis continue?”.
To answer the question, being the Chief Data Nerd at MORE, REALTORS, I naturally turned to the proprietary software we have developed to help our agents answer questions like this for their clients. Based upon the data I’m sharing below, I would say the short answer to the question is that St Louis home sales appear to be poised to continue at a historically strong rate, at least for the near future. Now for the caveats, of which there are two big ones: the first is that this is contingent upon listing inventory as if there is nothing to buy it doesn’t matter how many buyers you have, and the second is absent something dramatic happening to the economy to really rock the boat. For the former question, I’ll address that in the next day or so with an article in which I’ll look at the listing inventory trend for St Louis.
Leading Indicators…
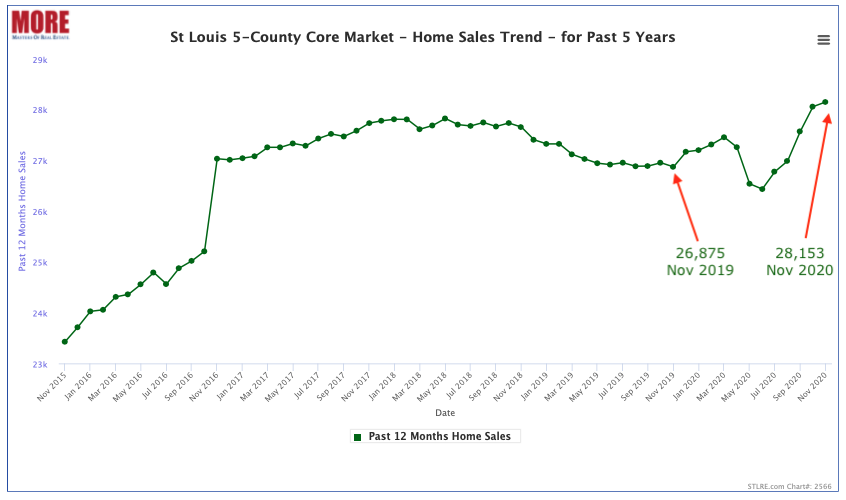
Looking at how many sales closed is helpful to see how the market is doing, but it’s much more advantageous and accurate to look at the current activity in the market, the leading indicators if you will, which are new contracts written on listings. Our exclusive Leading Indicators reports below show that all 5 counties in the St Louis Core market saw an increase in the number of new contracts written in the past week from the same week a year ago, in fact, overall a 21% increase. The second report below shows the same data versus the prior week and it shows an overall decrease of 10% in the number of new contracts from the week before with 3 of the five counties showing a decrease, but given that we are headed toward winter and the holidays this is normal. Finally, the chart at the bottom, another exclusive feature of MORE, REALTORS, which illustrates the prior 12-month home sales for each month in the past 5 years, clearly indicates an upward trend. For the 12-month period ending November 30 (which isn’t even over yet), there have been 28,153 homes sold, an increase of nearly 5% from a year ago.
[xyz-ips snippet=”Homes-For-Sale-and-Listings-With-Virtual-Tours”]
St Louis Home Sales Contracts Written
St Louis 5-County Core Real Estate Market – wk end 11/21 vs prior year
(click on table for current data)
St Louis Home Sales Contracts Written
St Louis 5-County Core Real Estate Market – wk end 11/21 vs prior week
(click on table for current data)

St Louis Home Sales Trend-Past 5 Years
St Louis 5-County Core Real Estate Market
(click on chart for current data)