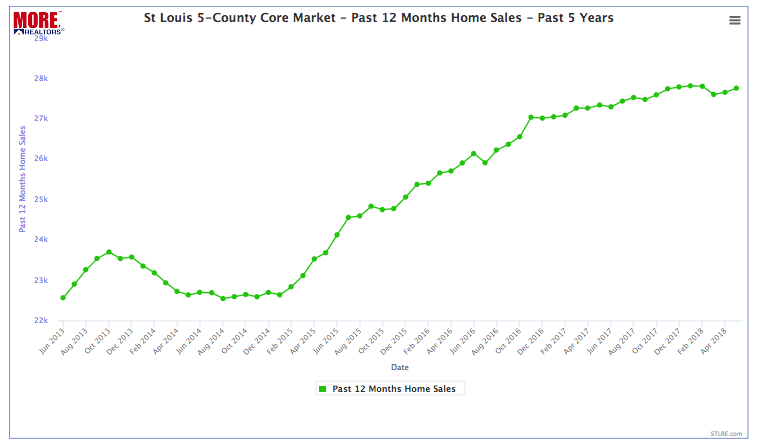
Homes have sold in the St Louis area at an increasing rate for a little more than 3 years now, however, as the chart below illustrates, the trend is flattening. The chart below, which was created from software our firm developed which compiles data from the MLS, plots homes sales for the past 12 months for each month. So, rather than just seeing the activity for one month and all the seasonal fluctuation, you can actually see the sales trend.
Since March 2015, the 12-month home sales trend has steadily increased at a fairly steady pace however, it appears we may have hit the ceiling. For the 12-month period ended May 31, 2018, there were 27,755 homes sold in the St Louis 5-County Core market (city of St Louis and counties of St Louis, St Charles, Jefferson and Franklin) a very slight increase over the 12-month period ended April 2018 when there were 27,653 homes sold and just a 1.5% increase from a year ago when there 27,339 homes sold in the prior 12-month period.
St Louis 5-County Core Market- 12-Month Home Sales Trend – Past 5 Years
(click chart for live chart and table)


