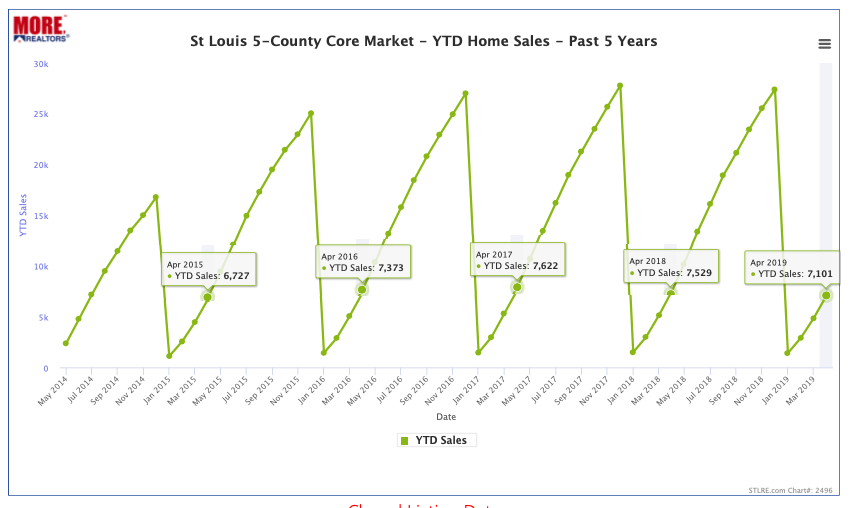
Home sales in St Louis through the end of April this year, are lower than they have been at the same time of year since 2015. As our exclusive year-to-date sales chart for the St Louis 5-County Core Market below shows, there have been 7,101 homes sold YTD this year (through 4/30) which is down 5.7% from the same time last year when there were 7,529 homes sold. The last time year-to-date home sales were lower at this time of year than now was back in 2015 when there were just 6,727 homes sold.
St Louis 5-County Core Market YTD Home Sales 2015-2019
St Louis home sales continue to trend downward …
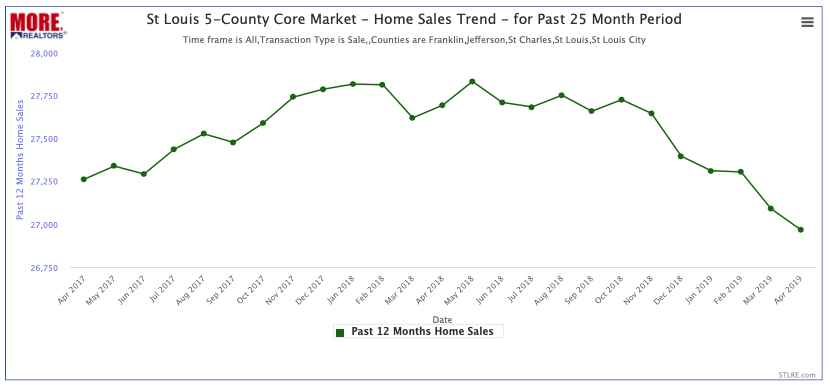
As our exclusive home sales trend chart below illustrates, the sales trend since October 2018 has been downward. This chart depicts the most recent 12 months of home sales for each month during the past 25 months making it an excellent tool to spot trends such as this. As the chart shows, the home sales trend peaked in May 2018 with 27,831 home sales in the prior 12 months. Before you get too distraught though, check out the 5 year version of this cahrt below.
St Louis 5-County Core Market- Home Sales Trend – Past 25 Months
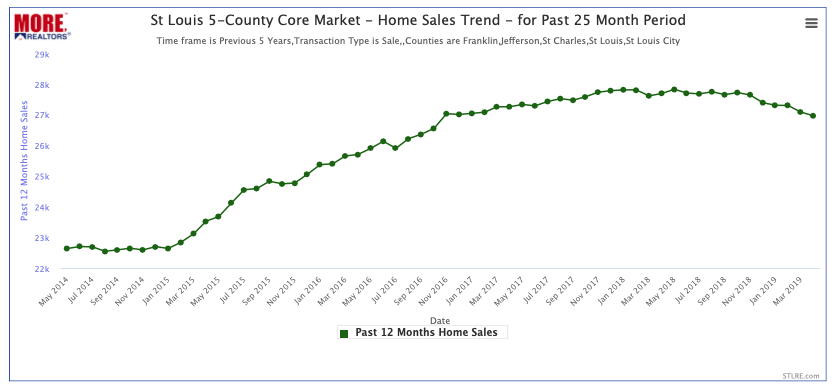
While the chart above is kind of scary and makes it look like the home sale trend is falling at a huge rate, the chart below puts it in a litte better perspective with a 5 year view of the home sales trend. As this chart depicts, the change in the trend is not that dramatic and St Louis home sales are still trending better than they did through November 2016.


