The COVID-19 pandemic (coronavirus) began impacting the St Louis area just a little over a month ago and I’ve been tracking the impact on the St Louis real estate market along the way. From the outset, we have seen a decline in the number of new listings, new sales and physical showings of listings, however, overall the decline has remained fairly constant. New sales of listings for the St Louis area has pretty well hovered around a level equal to about tw0-thirds of the activity we saw at the same time last year.
Now that we are about a month into the “COVID-19 effect”, a few weeks into the stay at home orders and a few weeks into real estate agents adjusting to doing business in a different way, I wanted to take an in-depth look to see where we stand now. I’ll warn you in advance, this article is a little long, mainly because of tables and data, but I wanted to include as much data as I could to paint the complete picture of the market.
[xyz-ips snippet=”Homes-For-Sale”]
Home sales are the best indicator of market confidence….
In my opinion, one of the best indicators of the confidence consumers may, or may not, have in the real estate market as well as the economy their outlook on their job, etc, is with home sales. If people feel pretty good about those aforementioned things and fairly comfortable with their financial situation, they buy, if not they don’t. As I have done over the past several weeks, I compiled data to show new sales activity in the most recent 7 day period and compared it with the same time period a year ago. My data comes from the MLS and due to MLS rules allowing agents 3 business days to report sales, I pulled data for the 7-day period ending April 9th since all sales should be reported by now.
As the tables below show, there we 868 new sales of residential listings in the St Louis MSA during the most recent 7 day reporting period, which is down 33% from a year ago. The St Louis 5-County core market home sales were down 33% as well with 642 new sales versus 957 a year ago. While the decline is significant, the number of people buying homes is significant as well and shows there remains a lot of confidence in the market.
New Residential Sales – St Louis MSA and 5-County Core Market vs Prior Year

New Residential Sales – 5-County Core Market By County vs Prior Year

New listings give insight into the confidence of Sellers in the market…
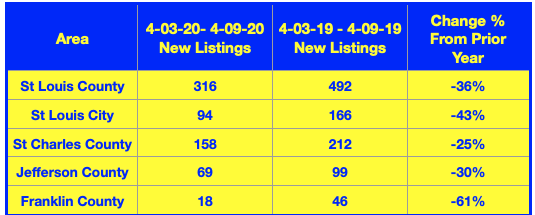
Just like new sales are a good indicator of what buyers are thinking, new listings during this period give us insight into the confidence sellers in St Louis have in the market. As the table below shows, new listings during the same 7-day period are down slightly more than sales during the same period. There were 877 new listings in the St Louis MSA during the 7-day period which is a decline of 38% from a year ago and there were 655 new listings in the 5-County core, a decline of 35% from a year ago.
This decline is not surprising as St Louis sellers express more concern about COVID-19 than buyers which makes sense as sellers have to deal with strangers coming into their home for showings. However, as agents adapt to new ways of doing business, this can be addressed. For example in our firm, MORE, REALTORS®, we have developed a Virtual Open House and Virtual Showing platform that allows our agents to use the latest technology to “show” homes without exposing clients to unnecessary health risks.
New Residential Listings – St Louis MSA and 5-County Core Market vs Prior Year

New Residential Listings – 5-County Core Market By County vs Prior Year
Decine in physical showings reveal COVID-19 concern as well as changing business models…
For the reasons expressed above, it’s not surprising to see the significant decrease in physical showings of listings we have seen. As the chart below illustrates, showings for the St Louis metro area (as well as surrounding markets served by MARIS, our regional MLS) are down a little over 47% from the same time last year. So, showings are down 44% more than sales are, what gives? I think this is the result of several things including the fact that the only buyers that are actually looking at homes are serious buyers ready to buy. People that may be thinking about making a move or toying with the idea may, in normal times, go out and see some listings to see what is out there but not today. In addition, as I mentioned, agents are employing different methods to show homes that don’t necessarily include a physical showing (such as a virtual showing) or may only include a physical showing after an intense vetting process by the buyer.
Impact of COVID-19 On Showings In St Louis
(click on chart for live, interactive chart)

March closings didn’t reflect much impact…
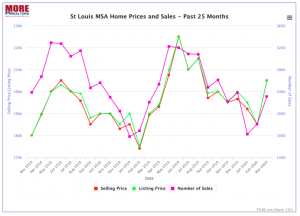
Our STL Market Report below shows home sales and prices for the St Louis MSA for the 12-month period ended March 31, 2020, and then compares it with the prior 12-moth period. As the table shows, home sales were up 1.44% for the most recent 12-month period and the prices of homes sold up 5.56% for the period. Since this is a 12-month report, the impact of a month is not really going to be reflected much. However, in our STL Market Chart below the table, you can see home sales by prices for the St Louis MSA by month. You will see that it shows there were actually 105 more homes sold last month (March 2020) than a year ago.
St Lous MSA – STL Market Report
(click on table for current table)
 St Louis MSA Home Sales and Prices – Past 25 Months (Chart)
(click on chart for live, interactive chart)
")
What does the future hold in store for the St Louis real estate market?
Sure, I’ll take a stab at a guess…I’m thinking that by, or on or about, May 1st, President Trump is going to encourage (order?) stay at home orders be lifted and let people get back to work. Our state-wide order ends April 24th and I don’t expect that to be extended or, if it is, not beyond May 1st. So, while we will be a long way from “normal” as I think masks, social distancing, etc will be around for months, I do think businesses will reopen and people will get back to work. Assuming this happens I expect the economy is going to have a quick and fairly strong recovery. If this happens as I expect, then it will be good for the St Louis real estate market and, again, if my guesses are right, then I would expect us to have a very robust summer market and end the year not far off from where we would have been if not for COVID-19.
On the other hand, if my guesses are wrong, remember, I’m just a real estate guy, what do I know? :)
Be safe and God Bless.
[xyz-ips snippet=”Homes-For-Sale”]
