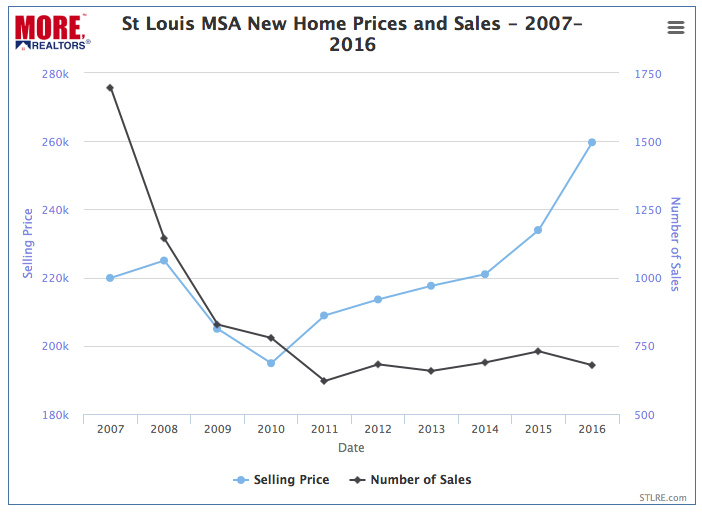
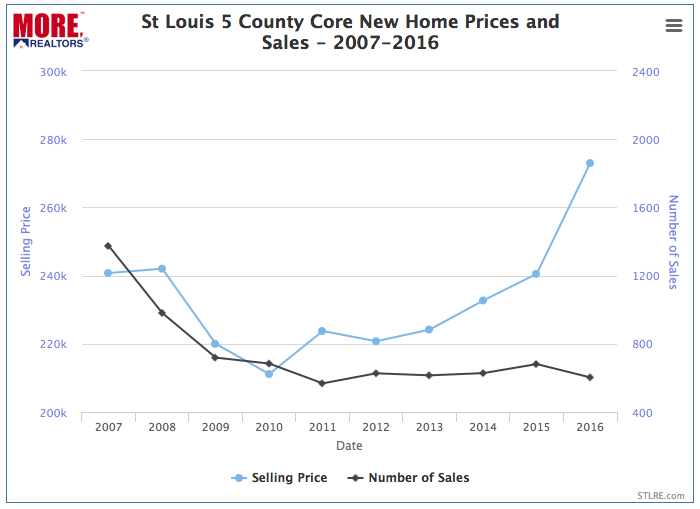
New home sales in St Louis declined in 2016 after increasing during the prior two years, for both the entire St Louis MSA as a whole as well as the St Louis 5-County Core Market. As the 10-year charts below show, new home sales, fell steadily from 2007 for about the next 4 years as a result of the housing bubble burst and failing real estate market. Since hitting rock bottom around 2011, new home sales have increased slightly but have not done so with any great momentum.
New home sales in St Louis 5 County Core Market are still just a fraction of what they were…
In 2007, there were 1,374 new home sales reported in the MLS in the St Louis core market, and last year there were 603 new homes sold, a decline of 56% from 2007. Last years new home sales were down over 11 percent from the year below and are lower than the prior 4 years. In fact, in the past 10 years, only 2011 saw fewer new homes sold with just 568 that year.
The median price of new homes sold, as the charts illustrate, dropped from $240,750 during 2007 until hitting bottom in 2010 at $211,144, and then after falling off the 2011 level in 2012, has increased every year since and hit $273,000 last year. This represents an increase of 29% in the median price of new homes sold in the St Louis core market since 2010.
New home sales increased last year in St Louis County but fell in St Charles and Jefferson Counties…
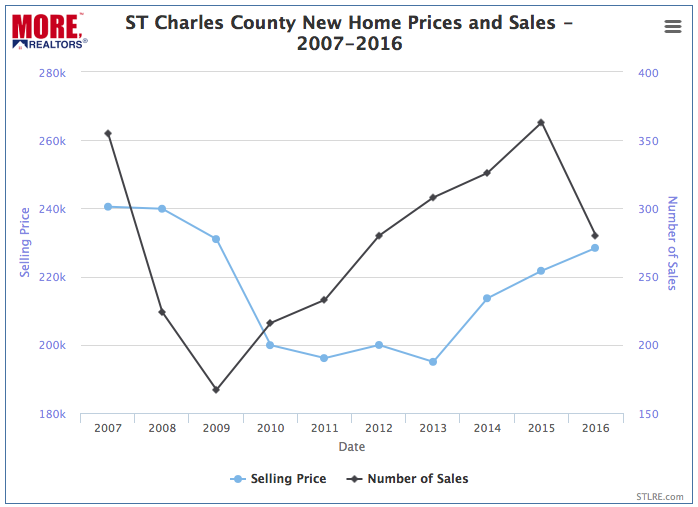
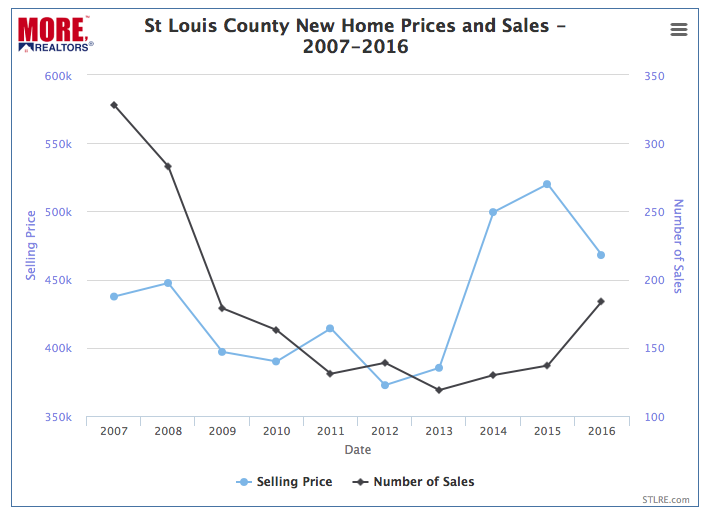
As the individual county charts below show, St Louis county saw the number of new homes sold increase last year from the year before, increasing 34% from 127 in 2015 to 184 new homes sold in 2016. The median price declined during this period however, from $520,000 during 2015 to $467,990 in 2016.
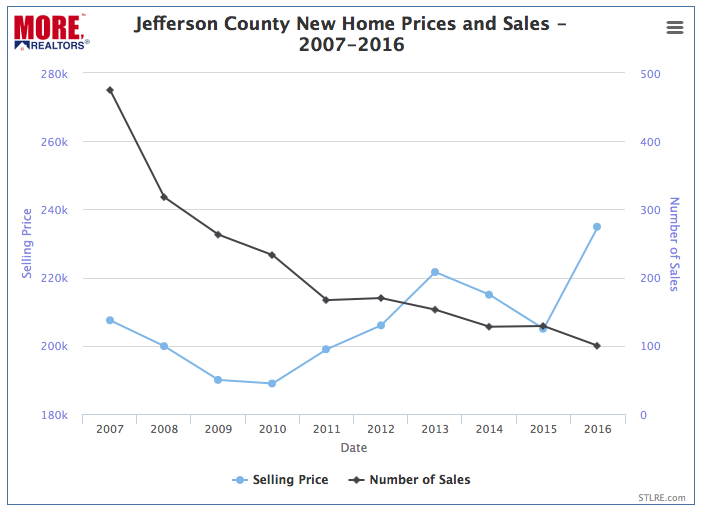
St Charles County saw new home sales decline nearly 23% (22.9) from 363 in 2015 to 280 during 2016 while prices increased from $221,705 to $228,424. Jefferson County followed suit with new home sales falling 22.5% from 129 during 2015 to 100 in 2016 while prices increased 14.6% during the same period from $205,000 in 2015 to $234,917 in 2016.
(We work hard on this and sure would appreciate a “Like”)[iframe http://www.facebook.com/plugins/like.php?href=https%3A%2F%2Fwww.facebook.com%2FStLouisRealEstateNews&send=false&layout=standard&width=50&show_faces=false&font&colorscheme=light&action=like&height=35&appId=537283152977556 100 35 ]
Search St Louis Homes For Sale HERE
Search St Louis New Homes For Sale
See ALL Homes That Will Be Open In St Louis This Weekend
St Louis MSA New Home Prices and Sales – 2007-2016 – Chart
St Louis 5 County Core Market New Home Prices and Sales – 2007-2016 – Chart
St Charles County Market New Home Prices and Sales – 2007-2016 – Chart
St Louis County Market New Home Prices and Sales – 2007-2016 – Chart
Jefferson County Market New Home Prices and Sales – 2007-2016 – Chart
