By Dennis Norman, on August 6th, 2020 During the second quarter of 2020, 9.8% of the homeowners in St Louis with a mortgage, were underwater on their mortgage, meaning they were in a negative-equity position, according to data just released by ATTOM Data Research. As the table below shows, this is the lowest level of St Louis homeowners that are seriously underwater since 2013 when this data was first tracked. In spite of financial difficulties and hardships that people may be suffering as a result of COVID-19, the downward trend of underwater homeowners in St Louis that began during the 3rd quarter of 2019 continues.
[xyz-ips snippet=”Homes-For-Sale-and-Listings-With-Virtual-Tours”]
St Louis Underwater (Negative-Equity) Homeowners
(Click on table for live, complete data from 2013-Present)

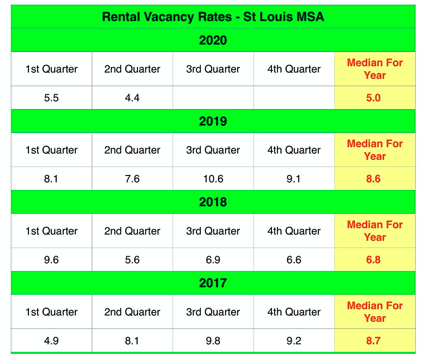
By Dennis Norman, on July 29th, 2020 The St Louis MSA rental vacancy rate during the 2nd quarter of 2020 was 4.4%, the lowest rate in over 15 years, according to data recently released by the U.S. Census Bureau. During the 2nd quarter of last year, the St Louis rental vacancy rate was 7.6%..
[xyz-ips snippet=”Foreclosures-For-Sale-and-Homes-For-Sale”]
St Louis Rental Vacancy Rates – 2005 – Present
(click on table for complete data from 2005 – present)”
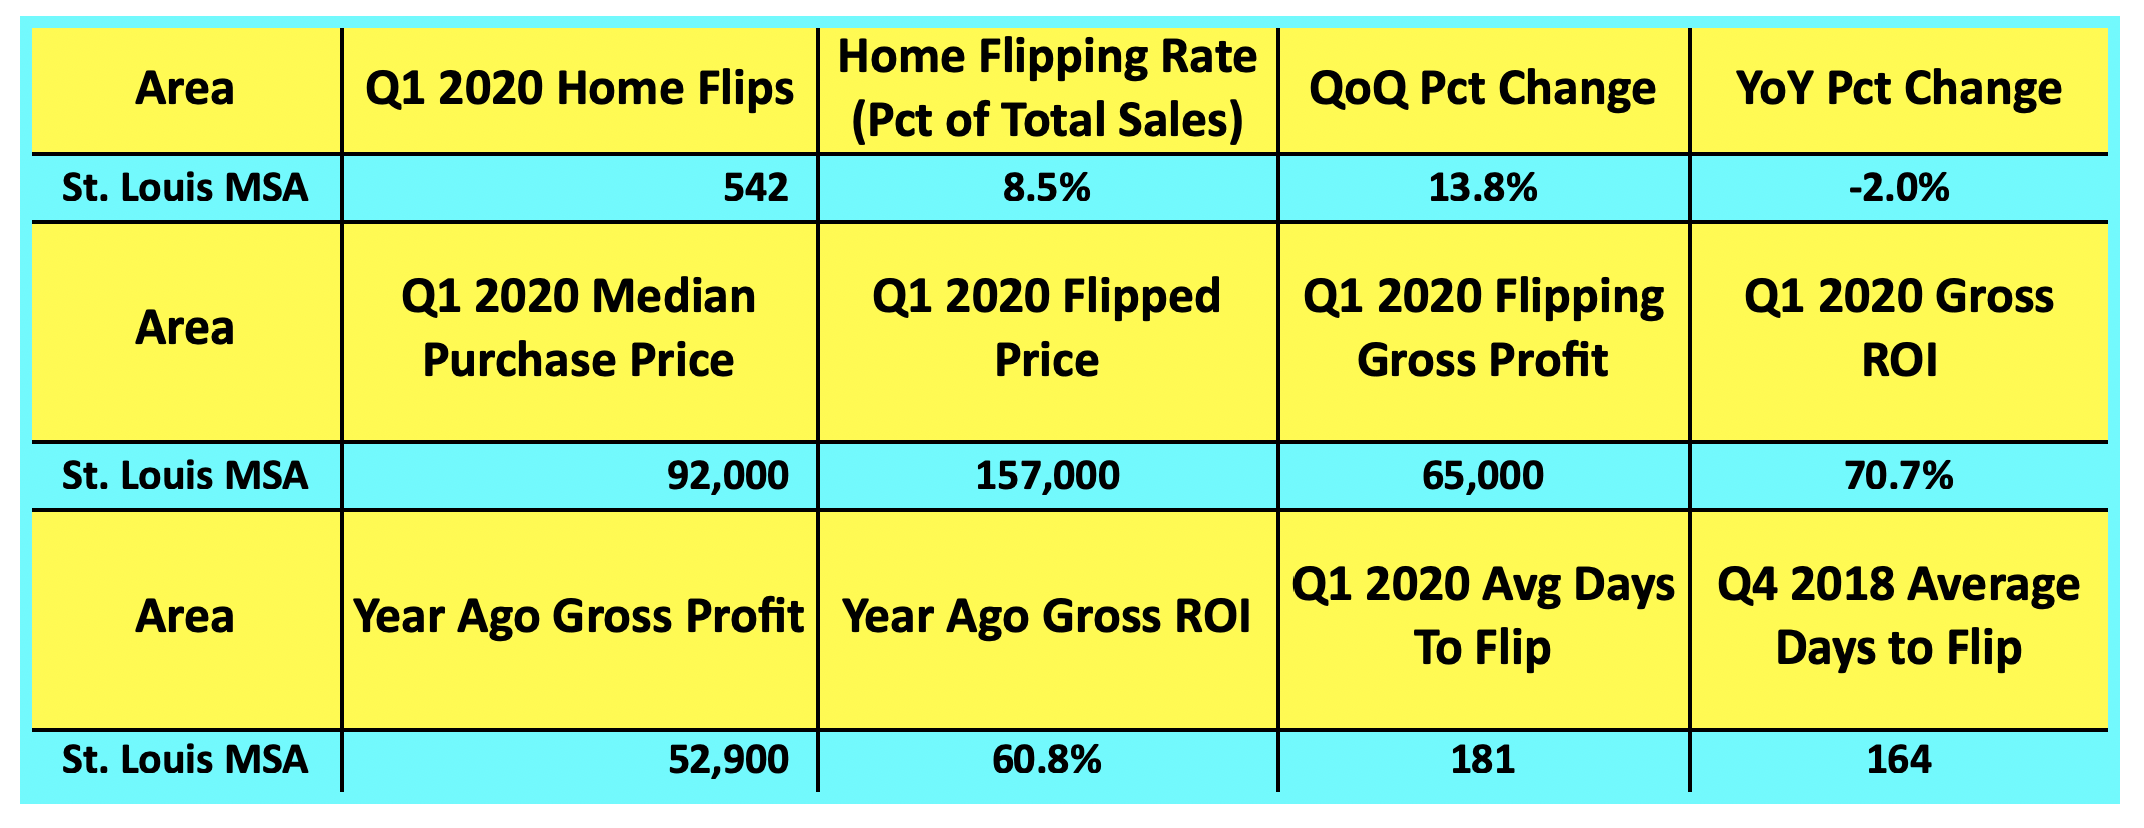
By Dennis Norman, on June 17th, 2020 There were 542 homes “flipped” in the St Louis metro area during the first quarter of 2020, or 8.5% of the total number of homes sold in the St Louis metro area during the quarter, according to data just released by ATTOM Data Solutions. This is an increase of 13.8% from the prior quarter and is a decrease of 2% from a year ago. The median gross profit was 52,900 a 60.8% gross ROI.
Definition of a “flipped” home…
For the purposes of this report, a flipped home is considered to be any home or condo that was sold during the first quarter of this year in an arms-length sale that had previously had an arms-length sale within the prior 12 months. Since homeowners don’t tend to buy a home only to turn around and resell it within a year, when this does occur it is typically the result of an investor buying a property, renovating it, then reselling it.
[xyz-ips snippet=”Foreclosures-For-Sale-and-Homes-For-Sale”]
St Louis House Flipping – 1st Quarter 2020
 © 2019 – St Louis Real Estate News, all rights reserved © 2019 – St Louis Real Estate News, all rights reserved
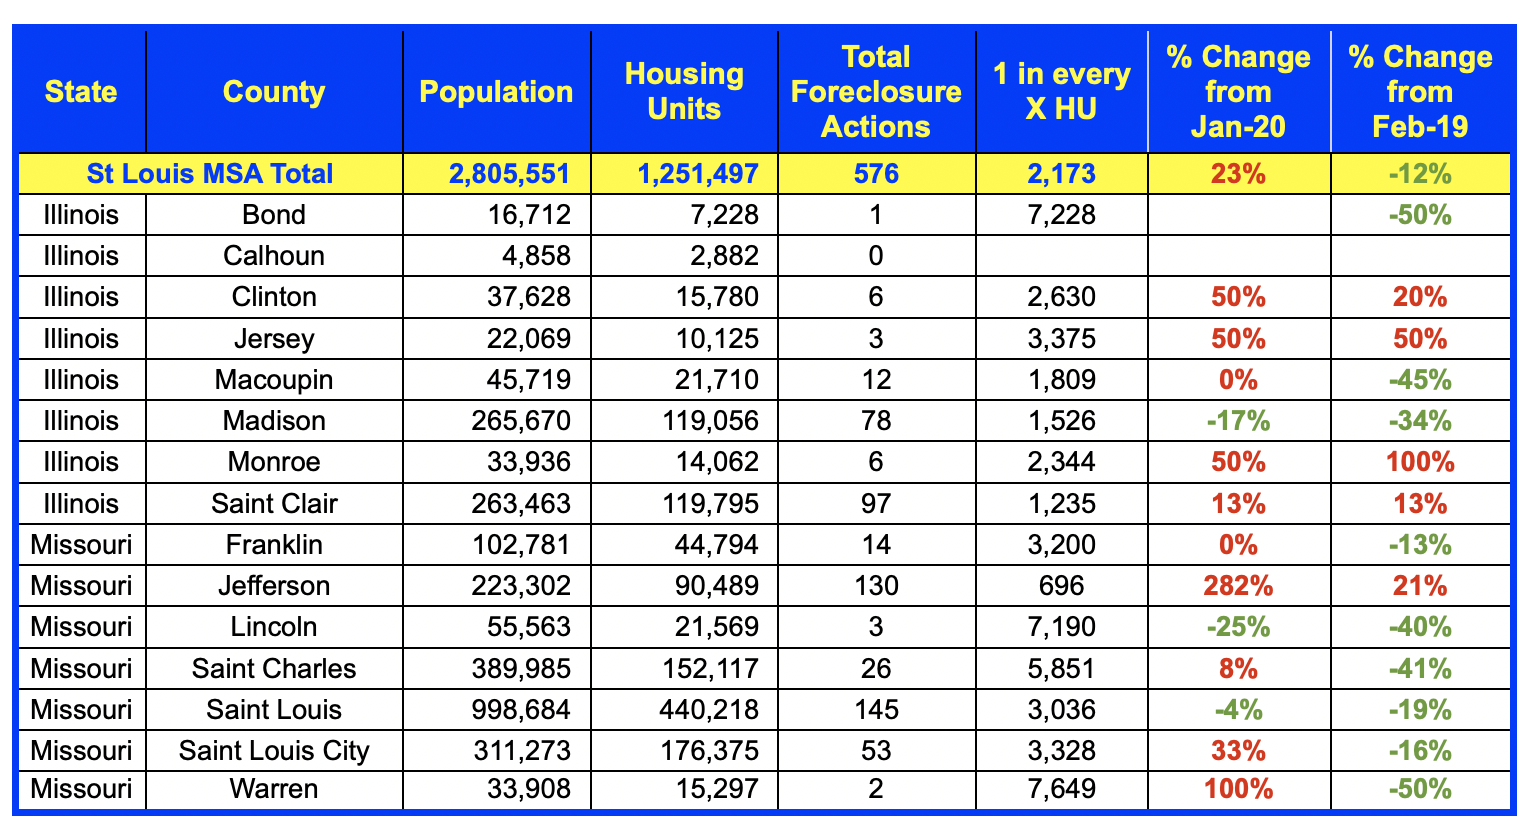
By Dennis Norman, on April 2nd, 2020 The foreclosure rate for the St Louis MSA during February increased 22.55 percent from the prior month but declined 12.0% from February 2019, according to data just released from ATTOM Data Solutions. As the table below shows, only 3 counties in the St Louis metro area saw a decline in foreclosure activity in February from the month before but 10 of the 15 counties reported saw a decline in foreclosure activity from a year ago.
Three counties, Madison in Illinois and St Louis and Lincoln in Missouri, saw a decline in foreclosure activity from both the month before as well as the year before.
[xyz-ips snippet=”Foreclosures-For-Sale-and-Homes-For-Sale”]
St Louis MSA Foreclosures – February 2020
By Dennis Norman, on March 18th, 2020 In response to the coronavirus pandemic, the U.S. Dept. of Housing and Urban Development (HUD), as well as the Federal Housing Finance Agency (FHFA) (which oversees Fannie Mae and Freddie Mac), directed their loan servicers to suspect foreclosures and evictions for at least 60 days to help those people affected.
In a statement, Mark Calabria, the Director of the FHFA, said that borrowers affected by the coronavirus who are having difficulty paying their mortgages should reach out to the mortgage servicers as soon as possible.
HUD Secretary Ben Carson said that “The halting of all foreclosure actions and evictions for the next 60 days will provide homeowners with some peace of mind during these trying times,”
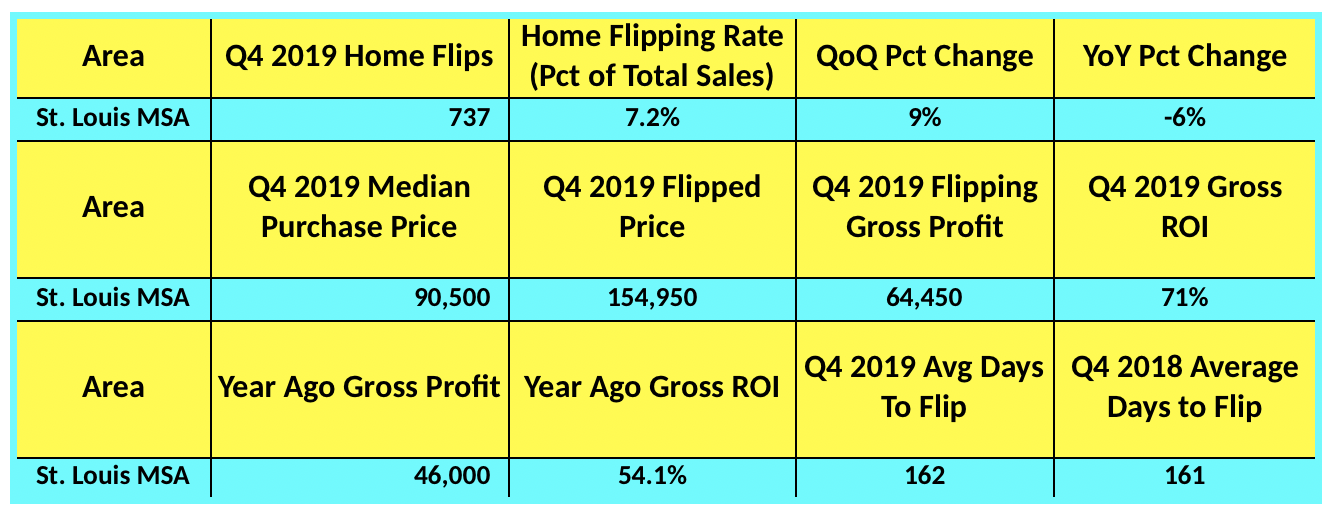
By Dennis Norman, on March 5th, 2020 There were 737 homes “flipped” in the St Louis metro area during the fourth quarter of 2019, or 7.2% of the total number of homes sold in the St Louis metro area during the quarter, according to data just released by ATTOM Data Solutions. This is an increase of 9% from the prior quarter and is a decrease of 6% from a year ago. The median gross profit was 64.450 a 71% gross ROI and a significant increase from a year ago when the Gross ROI was 54.1%.
Definition of a “flipped” home…
For the purposes of this report, a flipped home is considered to be any home or condo that was sold during the first quarter of this year in an arms-length sale that had previously had an arms-length sale within the prior 12 months. Since homeowners don’t tend to buy a home only to turn around and resell it within a year, when this does occur it is typically the result of an investor buying a property, renovating it, then reselling it.
[xyz-ips snippet=”Foreclosures-For-Sale-and-Homes-For-Sale”]
St Louis House Flipping – 4th Quarter 2019
 © 2019 – St Louis Real Estate News, all rights reserved © 2019 – St Louis Real Estate News, all rights reserved
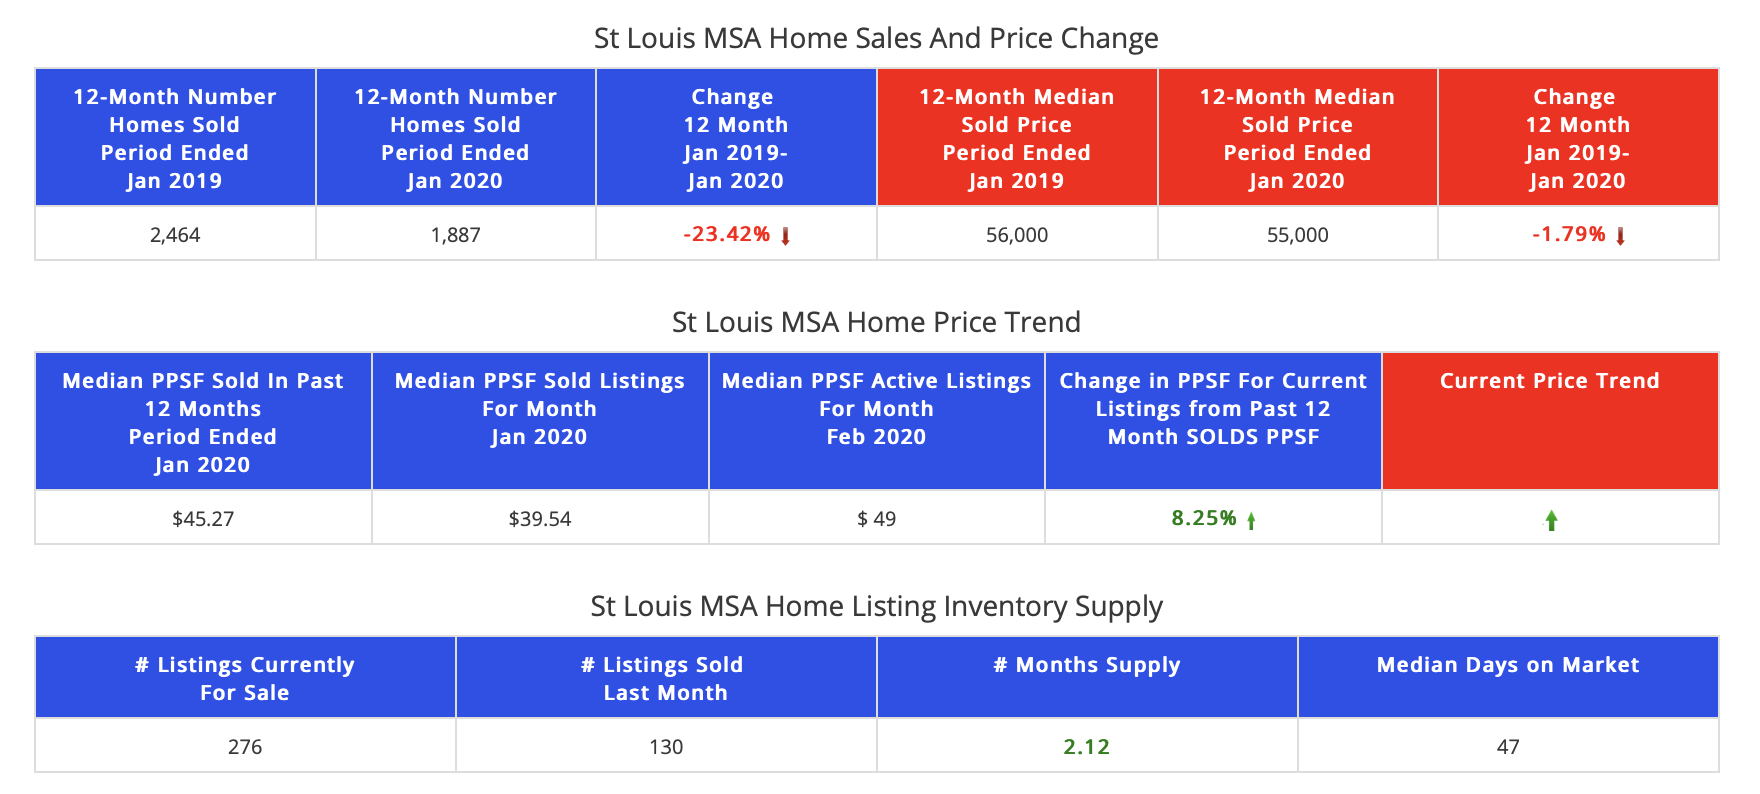
By Dennis Norman, on February 24th, 2020 Thanks to a booming economy and strong housing market, distressed home sales in the St Louis Metro Area declined by nearly 25 percent (23.42%) in the 12-month period ended January 31, 2020 from the prior 12-month period. As our exclusive, STL Market Report below shows, there were 1,887 distressed home sales (foreclosures, REO’s and short sales)in the most recent 12-month period compared with 2,464 in the prior 12-month period. The median home price of the distressed homes sold declined 1.79% during the same period, from a median price of $56,000 in the prior period to $55,000 in the most recent period.
[xyz-ips snippet=”Foreclosures-For-Sale-and-Homes-For-Sale”]
Distressed Home Sales St Louis MSA
(Foreclosures-REO’s-Short Sales) – Past 12 Months vs Prior 12 Months
(click on table for current report)
By Dennis Norman, on February 14th, 2020 As you may have noticed, I’ve been pretty optimistic about the outlook for the real estate market this year however, that is not always the case as I call it like I see it. The reason for my optimism is based upon what a true data geek like myself would base it upon, data! So, what’s the data that has me believing 2020 will be a good year for the housing market in St Louis and beyond? Several things:
- As I have been reporting here for the past couple of years now, mortgage delinquency and foreclosure rates have continued to decline which show the strength of the economy as a whole as well as the housing industry.
- As the US Economic Indicators charts below show, since peaking around 2010, the unemployment rate, 30-year mortgage rate and mortgage delinquency rates have all steadily declines to either record lows or at least the lowest rate in recent history.
- As the St Louis unemployment, home prices and rent chart below shows, unemployment in St Louis has fallen to the lowest level in decades and the relationship between home prices and rents show home prices lagging behind rents indicating that we’ll likely see continued, good housing appreciation rates.
- As the 30-year fixed rate mortgage chart below shows, mortgage rates are at near record low rates giving buyers much more buying power. In my market update video I shared here a day or two ago I illustrate just how much more buying power this translates into.
- As I reported last week, St Louis home sales last year managed to top the prior year slightly, in spite of the low-inventory market we have been stuck in. This shows the demand that is out there.
- As I reported earlier this week, the home sales trend for 2020 in St Louis is in positive territory has well.
Continue reading “Why I’m Bullish On Real Estate For 2020“
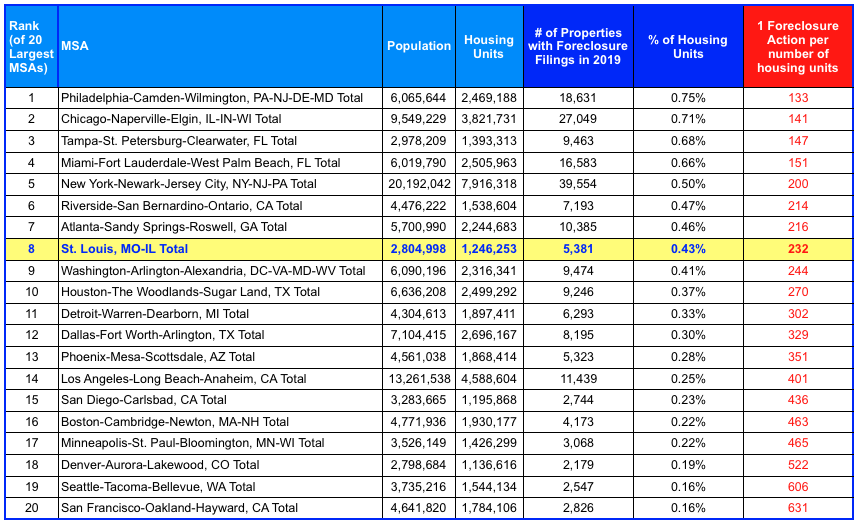
By Dennis Norman, on January 16th, 2020 Foreclosure rates and mortgage delinquency rates have steadily declined over the past couple of years as the housing market, as well as the overall economy, have both continued to improve and thrive. Nonetheless, foreclosures still take place and during 2019 the St Louis MSA had the 8th highest foreclosure rate of the 20 largest MSAs, according to the latest data released by Attom Data Solutions.
As the table below shows, during 2019, in the St Louis MSA there was 1 foreclosure action for every 232 housing units. Philadelphia, PA, had the highest foreclosure rate of the 20-largest MSAs with one foreclosure action for every 133 housing units and San Francisco had the lowest with one foreclosure action for every 631 housing units.
[xyz-ips snippet=”Foreclosures-For-Sale-and-Homes-For-Sale”]
2019 Foreclosure Rates – 20 Largest MSAs
 Copyright 2020 – St Louis Real Estate News – All rights reserved – Data Source ATTOM Data Solutions
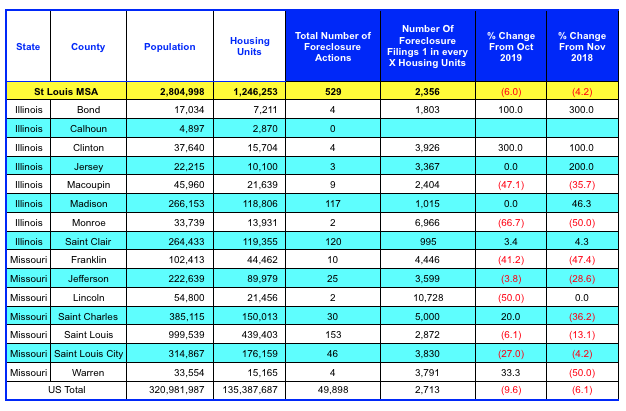
By Dennis Norman, on December 16th, 2019 The foreclosure rate for the St Louis MSA during October decreased 6.0 percent from the month and was down 4.2% from November 2018, according to data just released from ATTOM Data Solutions. As the table below shows, there were, like last month, some mixed results. For example, St Charles County saw a 20% increase in foreclosures from the month before while the City of St Louis saw a 27% decrease from the month before. The U.S. as a whole saw a bigger decline in foreclosure activity than the St Louis MSA did.
[xyz-ips snippet=”Foreclosures-For-Sale-and-Homes-For-Sale”]
St Louis MSA Foreclosures – November 2019
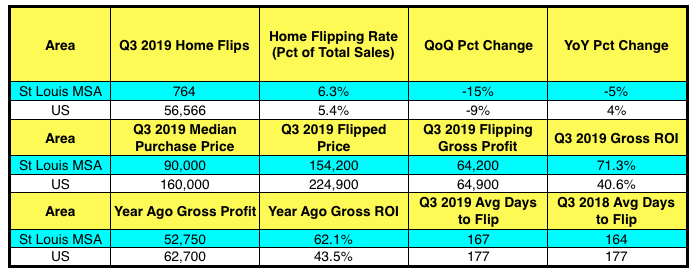
By Dennis Norman, on December 12th, 2019 There were 762 homes “flipped” in the St Louis metro area during the third quarter of 2019, or 6.3% of the total number of homes sold in the St Louis metro area during the quarter, according to data just released by ATTOM Data Solutions. This is a decline of 15% from the prior quarter as well as a 5% decrease from the prior year. As our table below shows, on a national level, house flipping accounted for just 5.4% of the homes sold during the 3rd quarter of this year, which is a 9% decrease from the quarter before and a 4% increase from a year ago.
Definition of a “flipped” home…
For the purposes of this report, a flipped home is considered to be any home or condo that was sold during the first quarter of this year in an arms-length sale that had previously had an arms-length sale within the prior 12 months. Since homeowners don’t tend to buy a home only to turn around and resell it within a year, when this does occur it is typically the result of an investor buying a property, renovating it, then reselling it.
[xyz-ips snippet=”Foreclosures-For-Sale-and-Homes-For-Sale”]
St Louis House Flipping – 3rd Quarter 2019
 © 2019 – St Louis Real Estate News, all rights reserved © 2019 – St Louis Real Estate News, all rights reserved
By Dennis Norman, on December 10th, 2019 The good news just keeps coming for the residential real estate industry! The most recent is from a report just released by CoreLogic showing the mortgage delinquency rate in the U.S. was at 3.8%, the lowest rate in at least 20 years! In addition, not one state in the country had an increase in overall delinquency rates in September.
Foreclosure Inventory Reaches Low as well…
The foreclosure inventory rate for September was 0.4%, another 20+ year low!
[xyz-ips snippet=”Interest-Rates-and-Mike-McCarthy-Promo”]
By Dennis Norman, on November 20th, 2019 As the table below shows, from MORE, REALTORS® exclusive STL Market Report, the overall St Louis MSA housing market has a current supply of homes for sale equal to just a little over two-and-a-half months making it very much favor sellers. The St Louis 5-County Core market (city of St Louis and counties of St Louis, St Charles, Jefferson and Franklin) have, as the second table shows, an even lower supply of homes for sale with a 2.32 month supply.
However, as the list at the bottom shows, there are some municipalities within the St Louis area that are buyers markets, 12 in total to be exact. A healthy inventory, one that is considered “balanced” and not favoring buyers or sellers, is generally 5 or 6 months, so to make this list of buyers markets there must be greater than a 6-month supply of home currently for sale. At the top of the list is Pine Lawn a small municipality in northern St Louis county, followed by Swansea IL and then Town and Country. Town and Country with 4 homes sold in the past month and 54 active listings currently has a 13.5 month supply of homes for sale.
Continue reading “St Louis Area Buyer’s Markets – Town and Country Near Top Of List“
By Dennis Norman, on November 19th, 2019 In August, the overall mortgage delinquency rate (30 or more days past due) was 3.7% for the U.S. which is a 0.2 percentage point decline from a year ago and is the lowest overall delinquency rate in 14-years, according to date just released by CoreLogic. The delinquency rate for August of 3.7% marks the lowest delinquency rate during the month of August in 20 years. The serious delinquency rate (120+ days late) decline of 1.2% a year ago to just 1.0% in August 2019, nearly a record low. The Foreclosure Rate fell in August 2019 to 0.4% from 0.5% a year ago.
Missouri mortgage delinquency rates are low as well…
During August 2019, the overall mortgage delinquency rate for Missouri was exactly the same as the national rate, 3.7%. The serious delinquency rate in Missouri was 1.1%, just slightly above the national rate, and the foreclosure rate was 0.2%, half of the national rate.
See the current mortgage interest rates here.
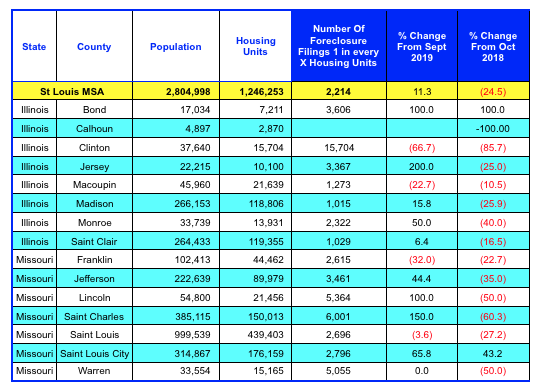
By Dennis Norman, on November 14th, 2019 The foreclosure rate for the St Louis MSA during October increased 11.3 percent from the month before however, it was still nearly 25 percent (24.5%) lower than October 2018, according to data just released from ATTOM Data Solutions. As the table below shows, there were some real mixed results this month. For example, St Charles County saw a 150% increase in foreclosures from the month before increasing from 10 in September to 25 in October but is down over 60% from October 2018. The city of St Louis is the only county of significant size in the St Louis MSA that saw both an increase in foreclosures from the month before (65.8^) as well as an increase from a year ago (43.2%).
[xyz-ips snippet=”Foreclosures-For-Sale-and-Homes-For-Sale”]
St Louis MSA Foreclosures – October 2019
By Dennis Norman, on November 2nd, 2019 The St Louis MSA homeowner vacancy rate during the 3rd quarter of this year was 1.8%, an increase from 0.3% the prior quarter and the highest rate since the 4th quarter of 2016 when the rate was 3.0%, according to data recently released by the U.S. Census Bureau. The median vacancy rate for 2019 though, at 0.5%, is still at a record low.
The homeowner vacancy rate represents the percentage of total listings of homes for sale that are vacant.
[xyz-ips snippet=”Foreclosures-For-Sale-and-Homes-For-Sale”]
St Louis Homeowner Vacancy Rates – 2016 – Present
(click on table for complete data from 2005 – present)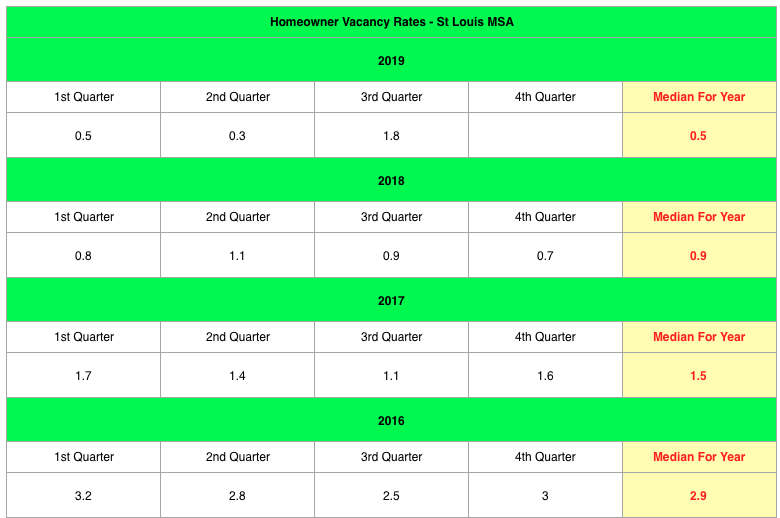
By Dennis Norman, on November 1st, 2019 The St Louis MSA rental vacancy rate during the 3rd quarter of this year was 10.6%, an increase from 7.6% the prior quarter and the highest rate since the 1st quarter of 2016 when the rate was 12.2%, according to data recently released by the U.S. Census Bureau. Last year, the median rental vacancy rate for the St Louis MSA for the year was 6.8%, a 13 year low.
[xyz-ips snippet=”Foreclosures-For-Sale-and-Homes-For-Sale”]
St Louis Rental Vacancy Rates – 2016 – Present
(click on table for complete data from 2005 – present)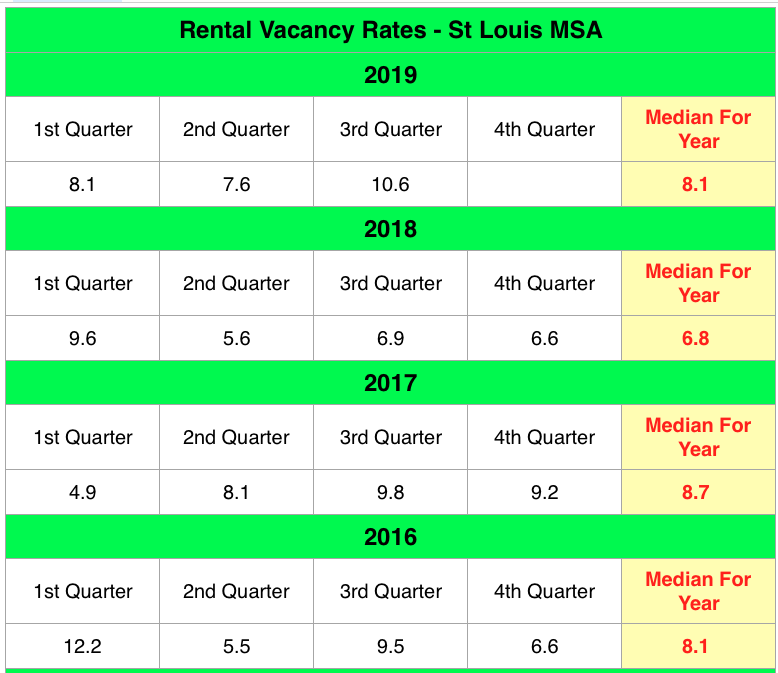
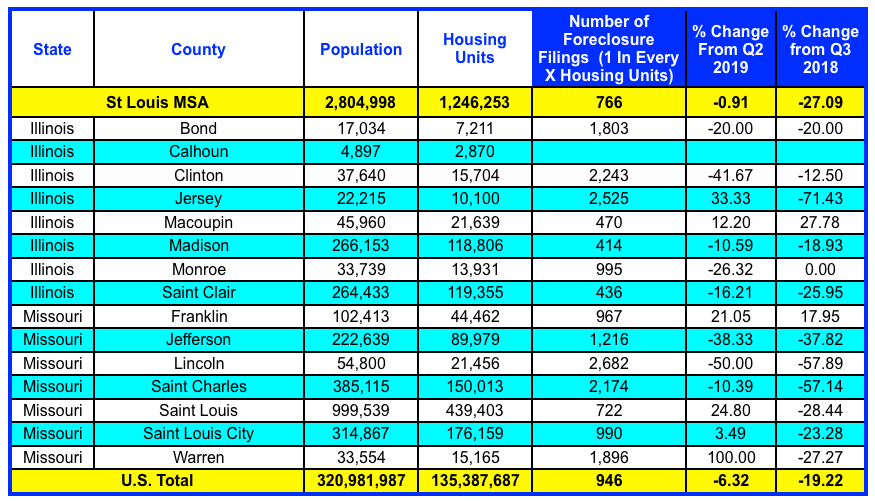
By Dennis Norman, on October 18th, 2019 The St Louis foreclosure rate during the 3rd quarter of this year was 1 in every 766 housing units, a decline of nearly 1% from the prior quarter and a decline of over 27% from a year ago, according to data just released from ATTOM Data Solutions. As the table below shows, 6 of the counties in the St Louis MSA saw an increase in the foreclosure rate during the 3rd quarter from the prior quarter and only two counties saw an increase from a year ago.
[xyz-ips snippet=”Foreclosures-For-Sale-and-Homes-For-Sale”]
St Louis MSA Foreclosures – 3rd Quarter 2019
By Dennis Norman, on October 15th, 2019 St Louis is the top marketing for flipping homes, according to an article published yesterday on Realtor.com. It’s not all just flipping activity however in the article a very notable and credible St Louis industry source (unabashed self-promotion) stated that “flipping is more common in homes in the $175,000-plus range, while many of those listed for $125,000 and less are being turned into rentals, says Norman.”
The Realtor.com article gave an overview of the market data I produced for them so I wanted to share the market data behind the overview.
St Louis Neighborhoods With Large Investor Presence:
- 63137 Zip Code Area (Bellefontaine Neighbors/Glasgow Village) – 43.5% of housing units are investor-owned
- 63135 Zip Code Area (Ferguson) – 39.2% of housing units are investor-owned
- 63033 Zip Code Area (Florissant Area) – 21.8% of housing units are investor-owned
Home Prices In St Louis’ Active Investor Markets:
Continue reading “St Louis Is Number One Market For Flipping Homes“
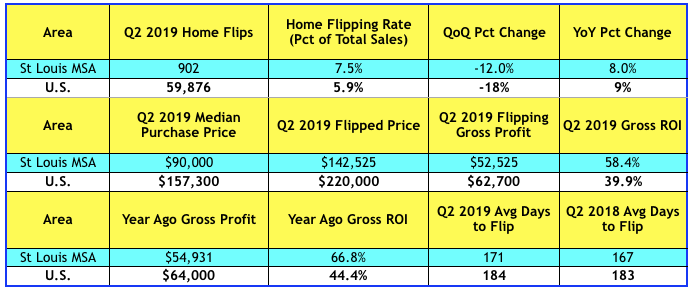
By Dennis Norman, on September 19th, 2019 There were 902 homes “flipped” in the St Louis metro area during the second quarter of 2019, or 7.5% of the total number of homes sold in the St Louis metro area during the quarter, according to data just released by ATTOM Data Solutions. This is a decline of 12% from the prior quarter but is an 8% increase from the prior year. As our table below shows, on a national level, house flipping accounted for just 5.9% of the homes sold during the 2nd quarter of this year, which is an 18% decrease from the quarter before and a 9% increase from a year ago.
Definition of a “flipped” home…
For the purposes of this report, a flipped home is considered to be any home or condo that was sold during the first quarter of this year in an arms-length sale that had previously had an arms-length sale within the prior 12 months. Since homeowners don’t tend to buy a home only to turn around and resell it within a year, when this does occur it is typically the result of an investor buying a property, renovating it, then reselling it.
[xyz-ips snippet=”Foreclosures-For-Sale-and-Homes-For-Sale”]
St Louis House Flipping – 2nd Quarter 2019
 © 2019 – St Louis Real Estate News, all rights reserved © 2019 – St Louis Real Estate News, all rights reserved
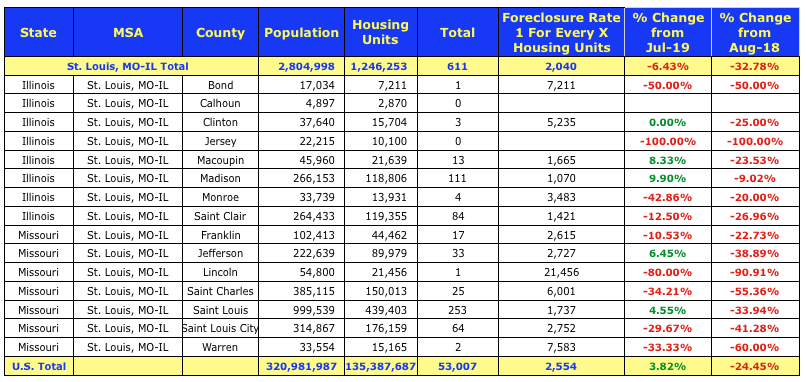
By Dennis Norman, on September 14th, 2019 During August there was one foreclosure action for every 2,040 housing units in the St Louis MSA, a decline of 6.43% from the month before and a decline of 32.78% from a year ago, according to data just released from ATTOM Data Solutions. As the table below shows, only 4 of the counties in the St Louis MSA saw an increase in the foreclosure rate for August 2019 from the month before, but all counties saw a decline from August 2018.
[xyz-ips snippet=”Foreclosures-For-Sale-and-Homes-For-Sale”]
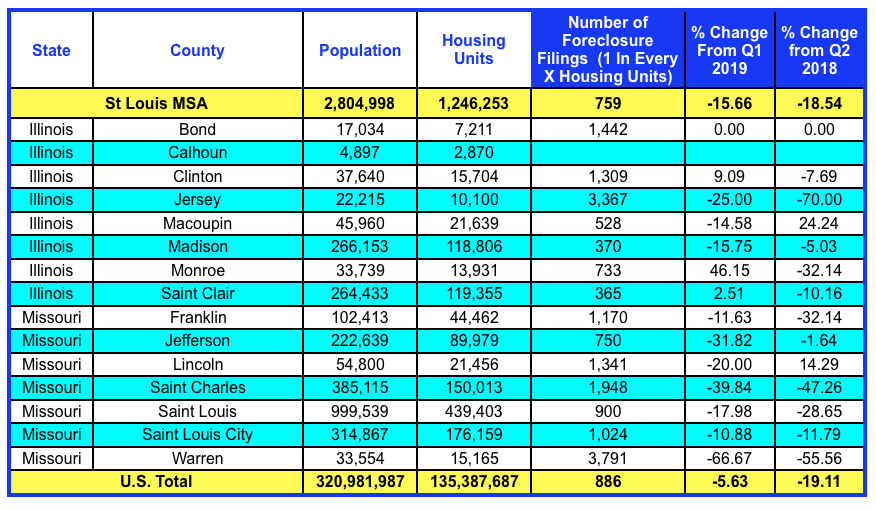
By Dennis Norman, on August 7th, 2019 The rate of foreclosure in St Louis during the 2nd quarter of this year was 1 foreclosure filing for every 759 housing units, a decrease of 15.68% from the prior quarter and a decline of 18.54% from the 2nd quarter of 2018, according to data just released by ATTOM Data Research. St Louis has the 73rd highest foreclosure rate of the 220 MSA’s ranked in the report.
As the table below shows, only three counties in the St Louis MSA saw an increase in foreclosure activity this quarter from the prior quarter and, with the exception of Lincoln County, none saw an increase from a year ago.
[xyz-ips snippet=”Foreclosures-For-Sale-and-Homes-For-Sale”]
St Louis MSA Foreclosure Rate By County – 2nd Quarter 2019
Data Source: ATTOM Data Solutions -©2019 St Louis Real Estate News – All Rights Reserved
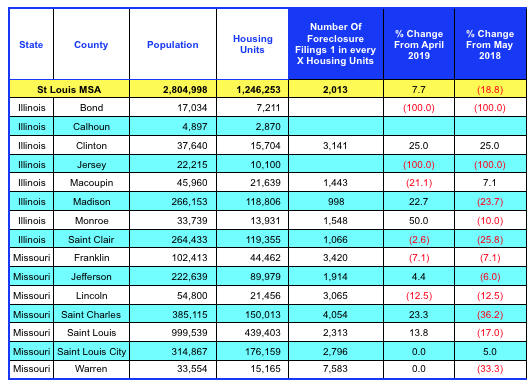
By Dennis Norman, on June 13th, 2019 The rate of foreclosure in St Louis in May was 1 foreclosure filing for every 2,013 housing units, an increase of 7.7% from the month before but a decline of 18.8% from May 2018, according to data just released by ATTOM Data Research.
As the table below shows, six counties in the St Louis MSA saw an increase in foreclosure activity in May from the month before however, all the counties in the St Louis MSA except 3, saw a decline from a year ago.
[xyz-ips snippet=”Foreclosures-For-Sale-and-Homes-For-Sale”]
St Louis MSA Foreclosure Rate By County – May 2019
Data Source: ATTOM Data Solutions -©2019 St Louis Real Estate News – All Rights Reserved
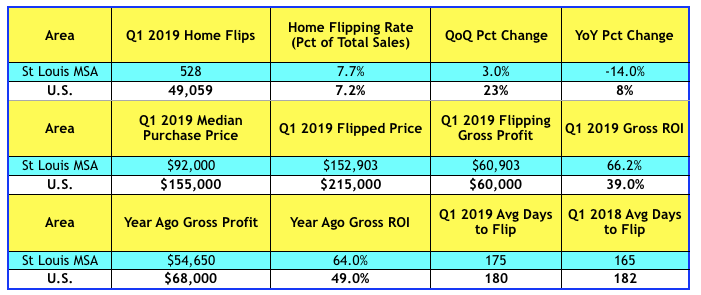
By Dennis Norman, on June 6th, 2019 There were 528 homes “flipped” in the St Louis metro area during the first quarter of 2019, which equated to 7.7% of the total number of homes sold in the St Louis metro area during the quarter, according to data just released by ATTOM Data Research. This is down 14% from the 1st quarter of 2018 but does reflect a 3% increase from the prior quarter. As our table below shows, on a national level, house flipping accounted for 7.2% of the homes sold during the 1st quarter of this year, which is a 23% increase from the quarter before and an 8% increase from a year ago.
Definition of a “flipped” home…
For the purposes of this report, a flipped home is considered to be any home or condo that was sold during the first quarter of this year in an arms-length sale that had previously had an arms-length sale within the prior 12 months. Since homeowners don’t tend to buy a home only to turn around and resell it within a year, when this does occur it is typically the result of an investor buying a property, renovating it, then reselling it.
[xyz-ips snippet=”Foreclosures-For-Sale-and-Homes-For-Sale”]
St Louis House Flipping – 1st Quarter 2019
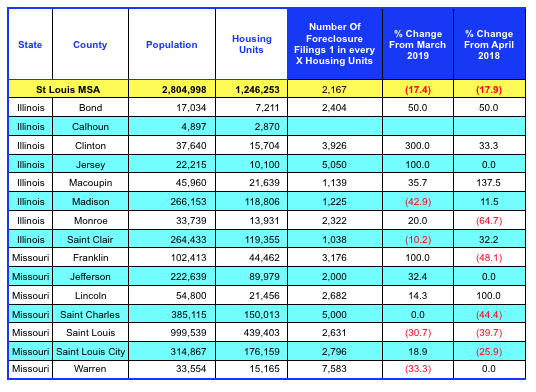
By Dennis Norman, on May 21st, 2019 The strong St Louis housing market, as well as the strong economy, continues to help improve mortgage delinquency rates and foreclosure rates in St Louis. The rate of foreclosure in St Louis in April was 1 foreclosure filing for every 2,167 housing units, a decline of 17.4% from the month before when the rate was 1 in every 1,865 housing units, according to the latest data from ATTOM Data Solutions. The April St Louis foreclosure rate was down 17.9% from the year before.
As the table below shows, over half the counties in the St Louis MSA saw an increase in foreclosure activity in April from the month before, all in the double-digits, however, with the exception of the city of St Louis, all of the larger counties saw a decline from the month before.
[xyz-ips snippet=”Foreclosures-For-Sale-and-Homes-For-Sale”]
St Louis MSA Foreclosure Rate By County – April 2019
Data Source: ATTOM Data Solutions -©2019 St Louis Real Estate News – All Rights Reserved
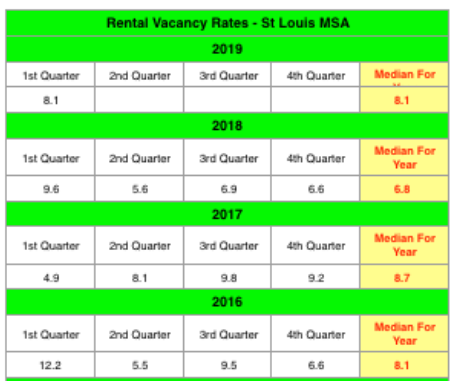
By Dennis Norman, on May 12th, 2019 The St Louis MSA rental vacancy rate during the 1st quarter of this year was 8.1%, an increase from 6.6% the prior quarter, according to data recently released by the U.S. Census Bureau. Given that for 2018 the median rental vacancy rate of 6.8% in the St Louis MSA was a 13 year low, it’s not surprising we may see an uptick in vacancies.
As the table below shows, the rental vacancy rate for the St Louis MSA for the first quarter of 2018 was 9.6% and then fell to 5.6% during the 2nd quarter so perhaps we’ll see a repeat of that this year as well but time will tell.
[xyz-ips snippet=”Foreclosures-For-Sale-and-Homes-For-Sale”]
St Louis Rental Vacancy Rates – 2016 – Present
(click on table for complete data from 2005 – present)
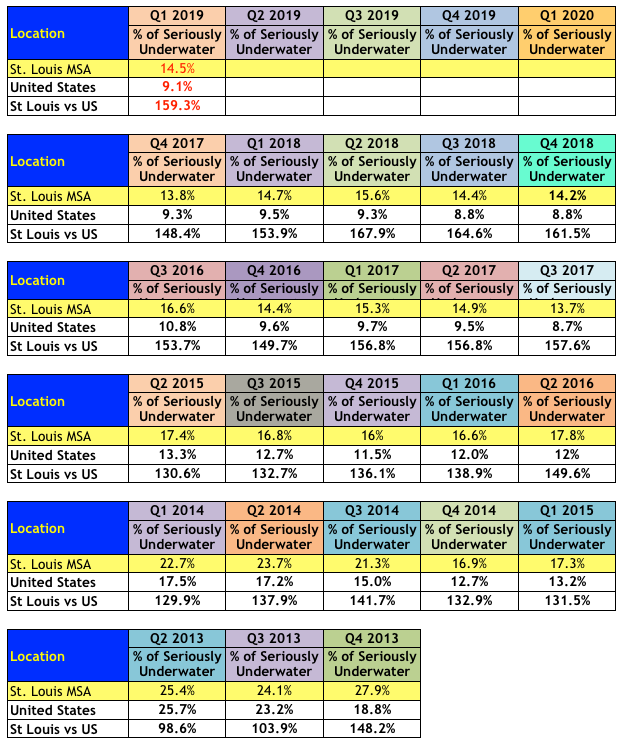
By Dennis Norman, on May 8th, 2019 During the first quarter of 2019, 14.5% of the homeowners in St Louis with a mortgage, were underwater on their mortgage, meaning they were in a negative-equity position, according to data just released by ATTOM Data Research. As the table below shows, this slight increase follows a decline in the rate for the two prior quarters. The St Louis negative-equity rate is about one and a half times that for the U.S. as a whole.
St Louis Underwater (Negative-Equity) Homeowners – 2013-2019
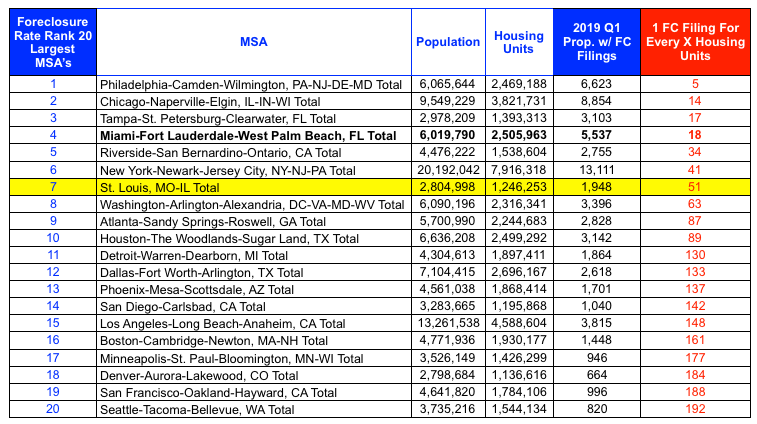
By Dennis Norman, on April 16th, 2019 During the first quarter of this year, there were foreclosure filings on 1,948 properties in the St. Louis MSA, which equates to 1 foreclosure filing for every 51 housing units, according to the latest data from ATTOM Data Research. As the table below, which shows data for the 20-largest metro areas in the U.S., shows, this foreclosure rate puts St Louis at number 7 on the list in terms of foreclosure rate.
[xyz-ips snippet=”Foreclosures-For-Sale-and-Homes-For-Sale”]
1st Quarter 2019 – Foreclosure Filings – 20 Largest MSA’s
Data Source: ATTOM Data Solutions -© 2019 St Louis Real Estate News
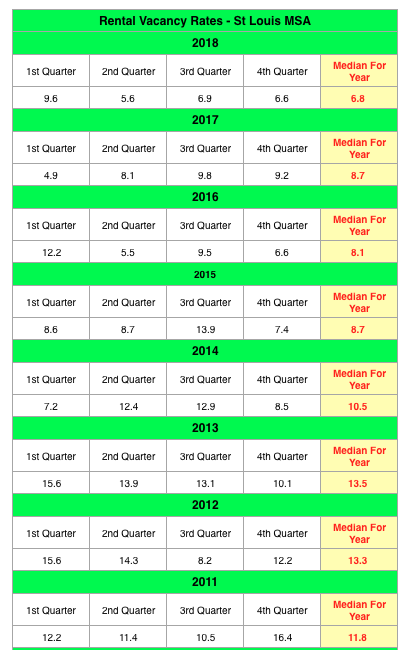
By Dennis Norman, on March 6th, 2019 The median rental vacancy rate for the St Louis metro area during 2018 was 6.8%, according to data recently released by the U.S. Census Bureau. This rate marks the lowest annual median rental vacancy rate for St Louis since the U.S. Census Bureau’s reports which began in 2005.
As the table below shows, the vacancy rate for the 4th quarter of 2018 was 6.6%, down from 6.9% the quarter before and down from 9.2% a year ago.
[xyz-ips snippet=”Foreclosures-For-Sale-and-Homes-For-Sale”]
St Louis Rental Vacancy Rates
By Dennis Norman, on February 28th, 2019 There were 3,143 home “flips” in the St Louis metro area during 2018, according to data just released by ATTOM Data Research. With 7.4% of homes sold in St Louis being a flip in 2018, this is a decline of 3.7% from a year ago. The peak number of flips in St Louis came in 2005 when there were 4,426 homes flipped.
What is meant by “flipped” home?
ATTOM Data considers any home or condo that was sold during the third quarter of this year in an arms-length sale that had previously had an arms-length sale within the prior 12 months as well as a “flip”. Since homeowners don’t tend to buy a home only to turn around and resell it within a year, when this does occur it is typically the result of an investor buying a property, renovating it, then reselling it.
[xyz-ips snippet=”Foreclosures-For-Sale-and-Homes-For-Sale”]
St Louis House Flips 2018

St Louis House Flips Average Gross Profit

|
Recent Articles
|


 © 2019 – St Louis Real Estate News, all rights reserved
 © 2019 – St Louis Real Estate News, all rights reserved


 © 2019 – St Louis Real Estate News, all rights reserved


 © 2019 – St Louis Real Estate News, all rights reserved


