When people say home prices are out of control, they are usually looking only at the price in dollars. Your chart shows why that can be misleading. In St. Louis, the median home price rose from about $39,000 in 1975 to about $340,000 today, and gold also went up about 8 to 10 times over that same period. That does not necessarily mean houses became dramatically more expensive in real terms. It shows how much buying power the dollar has lost.
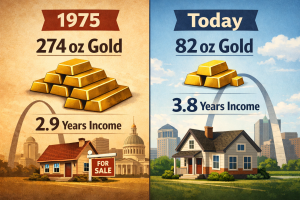
The gold comparison is what really changes the picture. In 1975, it took about 274 ounces of gold to buy a St. Louis area home. Today, it takes about 82 ounces. So while the dollar price of a house is much higher now, the amount of gold needed to buy that house is far lower. Measured in something that holds value better than paper currency, homes in St. Louis are actually cheaper today than they were 50 years ago.
The income side of the chart helps explain why many buyers still feel squeezed. In 1975, a St. Louis family earned about 97 ounces of gold per year. Today, that same year of income is worth only about 32 ounces of gold. In other words, household income has gone up in dollars, but its real purchasing power has fallen by roughly two-thirds when measured in gold. That is a big reason homes can feel expensive even when their real value has not surged.
Your affordability measure makes that point even clearer. In 1975, it took about 2.9 years of household income to buy a home. Today, it takes about 3.8 years. So the real change in affordability is not that it now takes some shocking multiple of income to buy a house. It is that buyers need roughly one more year of income than they did in 1975. That is a meaningful change, but it is nowhere near as dramatic as the jump in dollar prices makes it seem.
The takeaway for consumers is simple. Homes have done a much better job than cash at holding value over time. Gold and real estate both kept up while the dollar lost buying power. So if you are a homeowner, your home has likely protected your wealth better than money sitting in the bank. And if you are a buyer waiting for prices to fall, this chart suggests you may be focusing on the wrong number. The bigger issue may be the future buying power of your dollars, not just the sticker price of the home.