
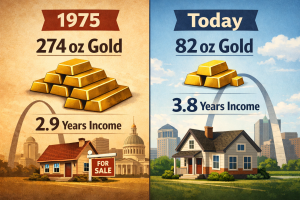
While the dollar-based chart shows an upward trajectory in home prices, surging over 250% since the year 2000, the same homes measured in gold reveal a different reality. Adjusted for gold, home prices today are about the same as they were in the late 1980s. This perspective highlights the impact of the dollar’s declining purchasing power over time rather than true appreciation in home values. The illusion of soaring prices is largely driven by the devaluation of the dollar, not necessarily by real growth in housing value.
For St. Louis home buyers and sellers, this means today’s high prices may not signify as much “appreciation” as they think. Sellers might consider this context when setting their expectations for value, while buyers should keep in mind that what they’re paying reflects broader monetary policies, not just local market conditions. The real estate market remains an excellent way to build wealth, but understanding its relationship with currency values provides a deeper insight into long-term investments.
The chart below illustrates this concept perfectly, with the green line representing home prices in dollars and the blue line reflecting prices in gold. Whether you’re buying or selling, this perspective is a reminder to look beyond the surface and consider what drives the numbers.
At MORE, REALTORS®, we’re committed to helping buyers and sellers navigate the real estate market with a clear understanding of market trends. Our team provides tools and insights to help you make confident decisions. Whether you’re investing in your first home or selling a long-held property, we’re here to assist.
Case-Shiller Home Price Index Both In Dollars (Green) and Gold (Blue)
 and Gold (Blue)")
Related Articles

Comments are closed.