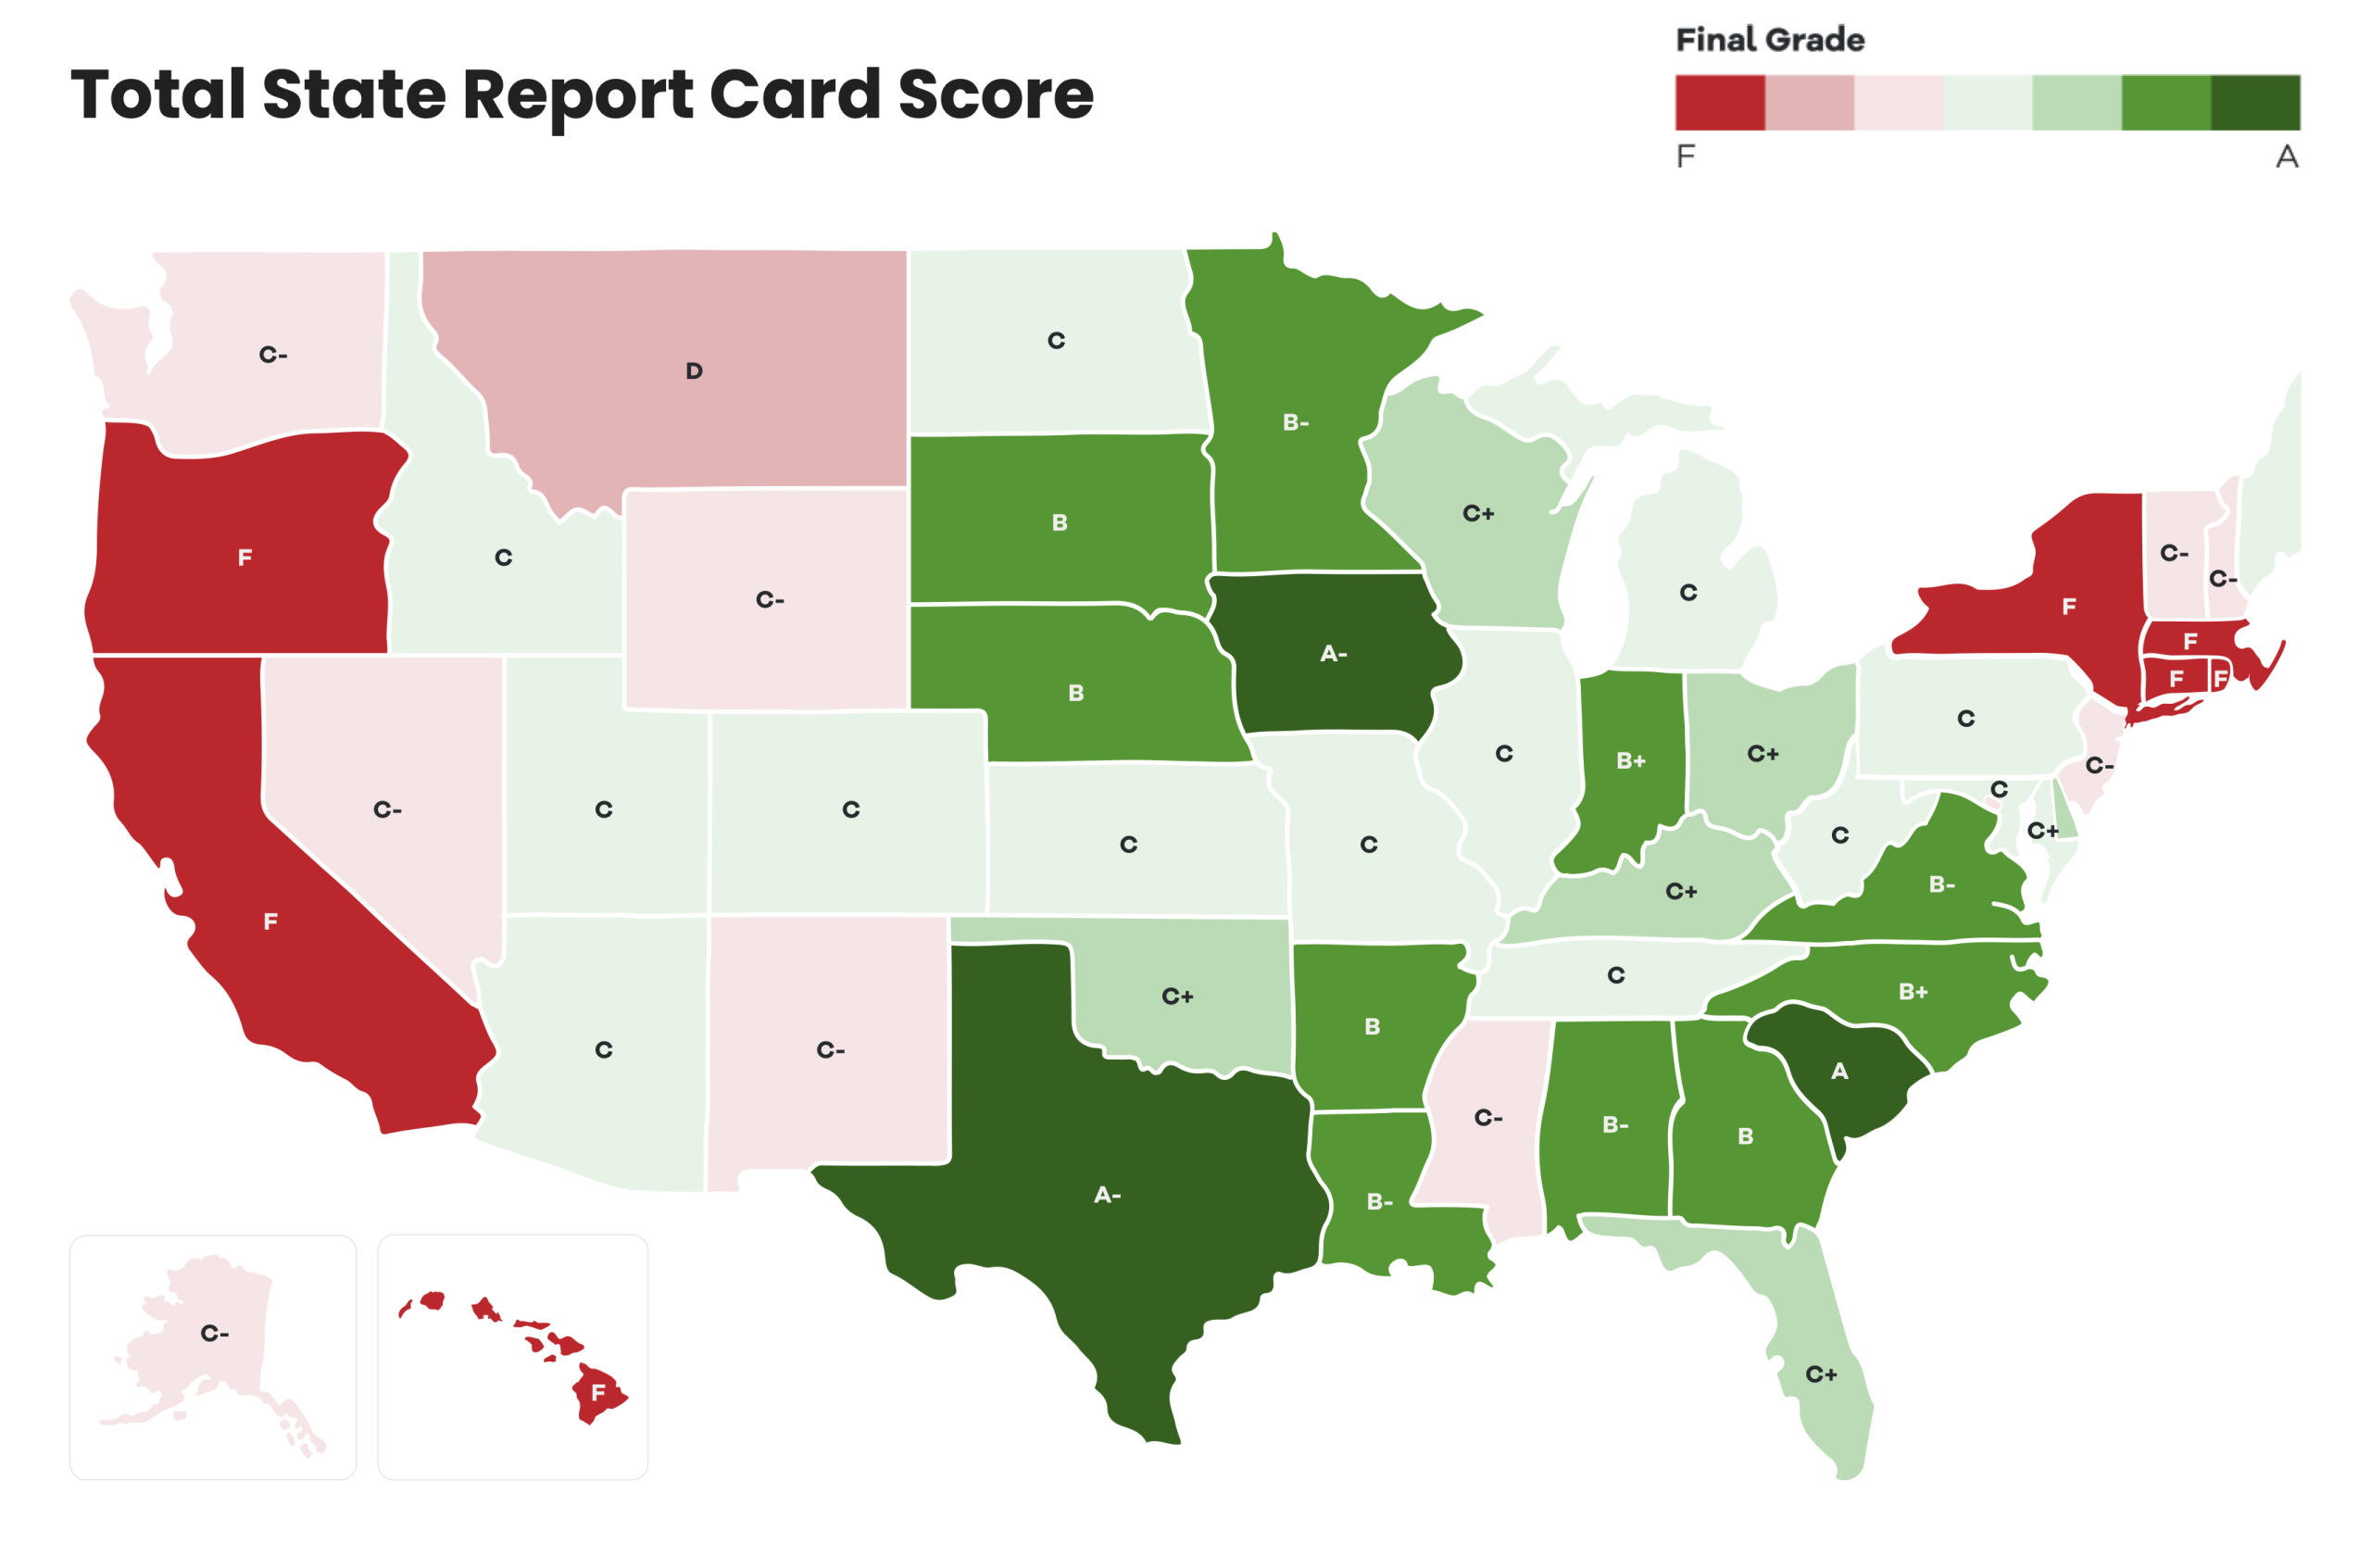
According to a recent report by Realtor.com, Missouri and Illinois rank in the middle of the pack when it comes to home affordability, with Missouri landing at #22 and Illinois at #30 among all 50 states and the District of Columbia. While neither state earned a top grade, both remain relatively affordable compared to coastal and western markets. Missouri received a “C” grade with a REALTORS® Affordability Score of 0.82 and a median listing price of $298,696. Illinois, also graded “C”, had a slightly higher affordability score of 0.86, a median home price of $316,613, and a notably higher median household income of $79,180.
For buyers in the St. Louis region, these numbers reinforce the area’s reputation as one of the more accessible major metros for homeownership. In Missouri, the affordability score reflects strong alignment between home prices and income, which, combined with moderate new construction premiums (50.9%), suggests a healthy balance of demand and development. Illinois also fares well in terms of affordability despite slightly higher home prices, bolstered by a larger share of population and housing permit activity.
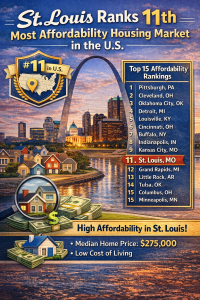
As affordability challenges grow in many markets, the St. Louis metro remains attractive for homebuyers, especially those relocating from more expensive regions. The affordability metrics for both Missouri and Illinois are favorable compared to national averages, providing a window of opportunity for first-time buyers, investors, and relocating families. For those looking to make a move in today’s complex market, working with an experienced agent from MORE, REALTORS® is a great way to make sense of current trends and navigate your next move confidently.
Missouri & Illinois Housing Affordability and Ranking
| State | Rank | Total Score | Grade | Affordability Score | Median Listing Price | Median Household Income | Share of 2024 Permits | Share of Population | New Construction Premium |
|---|---|---|---|---|---|---|---|---|---|
| Missouri | 22 | 56.2 | C | 0.82 | $298,696 | $68,010 | 1.2% | 1.8% | 50.9% |
| Illinois | 30 | 50.1 | C | 0.86 | $316,613 | $79,180 | 1.3% | 3.7% | 75.0% |
Housing Affordability Scorecard by State – Interactive Map
Click on map for live, interactive map