As the table and charts below illustrate, the St. Louis Metropolitatn Area (MSA) has undergone significant demographic shifts over the past 50 years, marked by a stark contrast between the population trends in the City of St. Louis and its surrounding counties.
St Louis MSA and Major Counties Population 1970-2022

The decline in the City of St. Louis’s population sharply contrasts with the growth in surrounding counties. During the same period that St. Charles County witnessed a 345% increase and the St. Louis MSA as a whole saw nearly a 60% rise, the City of St. Louis experienced nearly a 70% drop in population.
Over the last 50 years, the St. Louis MSA has undergone significant shifts in its population, characterized by substantial declines in the City of St. Louis and remarkable growth in suburban counties. This trend can largely be attributed to a combination of factors, including urban blight, which is characterized by the deterioration and abandonment of buildings, leading to a diminished quality of life and decreased property values. The escalation of crime rates further compounded the city’s challenges, rendering it less appealing for families and individuals in search of safe, stable environments. Furthermore, governance issues, marked by inefficient public services and policies that failed to effectively address the needs of urban residents, have also contributed to the population decline. These factors, coupled with the allure of suburban living—offering more spacious living conditions, better educational facilities, and a perceived higher level of safety—have propelled the demographic shift away from the city center and towards the suburbs.
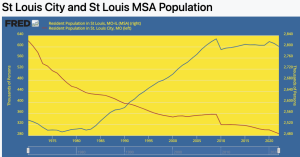
St Louis MSA and City of St Louis Population – 1970 – 2022 Chart
(click on chart for live interactive chart)

St Louis Major Counties Population- 1970 – 2022 Chart
(click on chart for live interactive chart)

ext-align: