The St Louis real estate and housing market saw a good year last year but, as we are frequently reminded, real estate is very “local” and prices, as well as market conditions, can vary widely even between cities or towns just a mile or two apart. This is clearly illustrated when I look at a report our company produces, based upon home sales data, obtained directly from the St Louis REALTOR® MLS, that shows the median price per foot for homes sold (or currently for sale) throughout the St Louis area. I like price per square foot data as I believe that is one of the more accurate ways of seeing trends in home prices. We compile this data and publish it live, and real-time, online, for each city in St Louis as well as zip code.
Search St Louis Homes For Sale HERE
Find Your Home’s Value Online NOW!
See ALL Homes That Will Be Open In St Louis This Weekend
St Louis Home Prices – Price Per Foot – Live Data Online – MLS Data – By City
St Louis Home Prices – Price Per Foot – Live Data Online – MLS Data – By Zip
Cities in St Louis where home prices have increased the most:
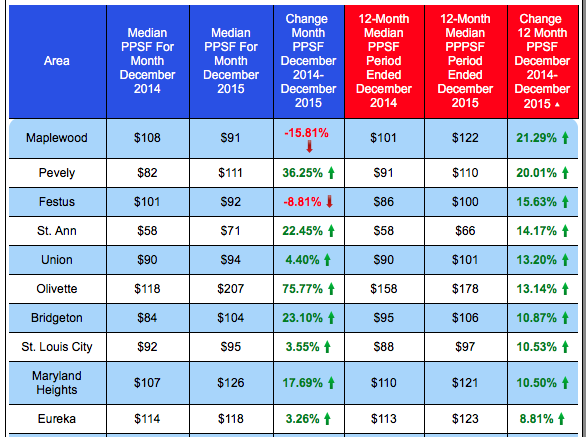
As the table below illustrates, the city of Maplewood saw an increase in home prices in 2015 of over 21 percent from the year before (on a price per foot basis), and two Jefferson County cities, Pevely and Festus, were right behind with a 20 percent and over 15 percent increase, respectively.
(click on the table to go to LIVE data online)
Cities in St Louis where home prices have decreased the most:
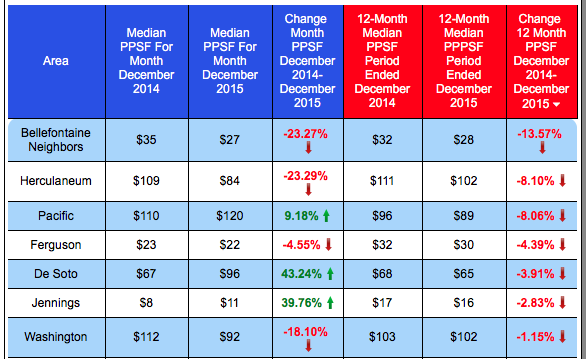
The good news is, there were only 7 cities within the five-county core St Louis market (city of St Louis and counties of St Louis, St Charles, Jefferson and Franklin) where home prices declined in 2015 from 2014 (on a price per square foot basis). At the top of the list is Bellefontaine Neighbors, a small community in north St Louis county that has taken a beating over the past several years, with a decrease of over 13 percent in home prices, followed by Herculaneum in Jefferson County, Pacific in Franklin County. Somewhat surprisingly given all of the recent problems faced by the city as well as negative attention it has received on not only a local, but a national level, the City of Ferguson placed 4th on the list with a decline in home prices of just 4.39 percent.


