The St Louis real estate market is definitely recovering from the housing bubble burst that sent it into a tail spin about six years ago. With the recovery, home sales have increased, although at a slower pace in 2014 than the year before, and St Louis home prices have increased but, in spite of this, are St Louis home prices too low?
To address this question I looked at the relationship between St Louis home prices, rent amounts and income over the past 15 years to see how the trends look and how where we are today compares. Below are the following charts as well as what I think they may indicate:
Search ALL St Louis Homes For Sale
See ALL Homes That Will Be Open In St Louis This Weekend
- St Louis Home Price Index vs St Louis Rent Price Index – this shows the relationship between home prices and rents. I can do a 2 hour presentation on this topic alone, but the short version is home prices are definitely tied to rental rates. As the chart shows, from 1990 until about 2000 the trend lines of home prices and rents were fairly consistent but then in 2000 home prices rose at a greater rate. The gap between home prices and rents widened until home prices peaked in 2007 shortly before the bubble burst. Today, the rent price trend remains constant but home prices have dropped below the rent price line and the gap has widening suggesting that home prices need to rise to get back in line with rents. (The Fed Reserve chart shown only has the home price index through 2013 and we have seen an increase in home prices in 2014, so the gap may have narrowed).
- St Louis House Price Index vs St Louis Per Capita Personal Income – This shows a similar pattern to the rent chart above with income and home price trends being fairly consistent until around 2000 and then home prices rose at a faster rate until the bubble burst. Now,like rents, home prices have fallen down below the income trend and the gap has widened. (The Fed Reserve chart for income only shows through 2012)
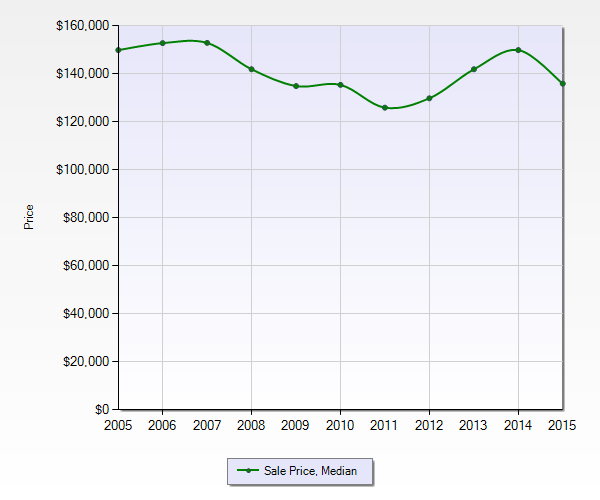
- St Louis Median Price of Homes Sold For Past 10 Years – This chart simply shows the median price of homes sold in the St Louis area over the past 10 years. As you can see, for 2014, prices were about the same as 10 years ago but 2015 has started off with a downward trend.
So, are St Louis home prices low or not? Well, now I’m going to give one of those attorney-like answers. Based upon the charts below, it certainly looks like they are (or were) perhaps low, based upon historical patterns, however, since some of the data reflected on the charts is a year or two old, and home prices have increased since, prices may have corrected already somewhat. The other thing to remember is real estate is VERY LOCAL so different areas of St Louis perform and behave differently. Some have recovered faster and prices may not only not be low but may be high while other areas may be underpriced. The bottom line is I think now is a very good time to buy as, depending on the location, prices may be a little low or perhaps about where they should be, but nothing below gives any indication prices are, by and large, too high.
Want to find out more or just on a specific location or area? No problem, I would be happy to help, just contact me by clicking on the button below and I’ll get your message.
St Louis House Price Index vs St Louis Rent Price Index

St Louis House Price Index vs St Louis Per Capita Personal Income

St Louis Median Price of Homes Sold For Past 10 Years