Everyone loves a deal! When it comes to buying a house, over the past few years there have been many “deals” out there as a result of the housing market meltdown. However, now that the worst of it is over, and many markets have already started recovering, the question for many are “where in St Louis can home buyers find a good deal?“. This is not easy to answer and what is a “good deal” for a home buyer looking for a place to call home for the foreseeable future is not necessarily going to be viewed in the same way by an investor looking to buy rental property or for something to flip. However, the are some basic market indicators that buyers can follow to point them in the right direction.
By looking at different types of market data it is pretty easy to determine what markets or neighborhoods are still challenged and where opportunities may be found out. Below are tables and charts that will help find those neighborhoods:
For Advice on How to Buy St Louis Foreclosures From A 2000+ Home Buyer Investor click here.
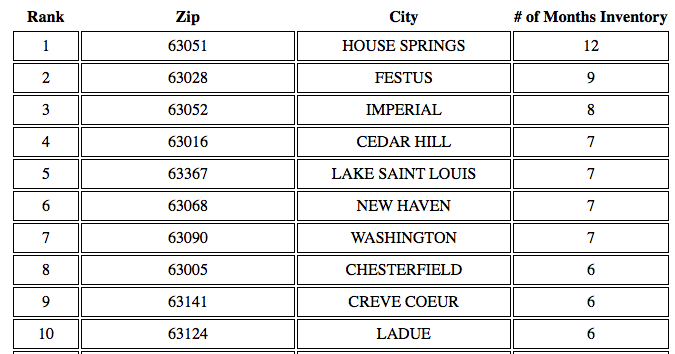
Inventory of Homes For Sale:
The table below shows the 10 St Louis neighborhoods with the highest number of months of inventory. A high supply of inventory typically leads to lower home prices as sellers realize they must lower prices to stand out from the abundant competition.
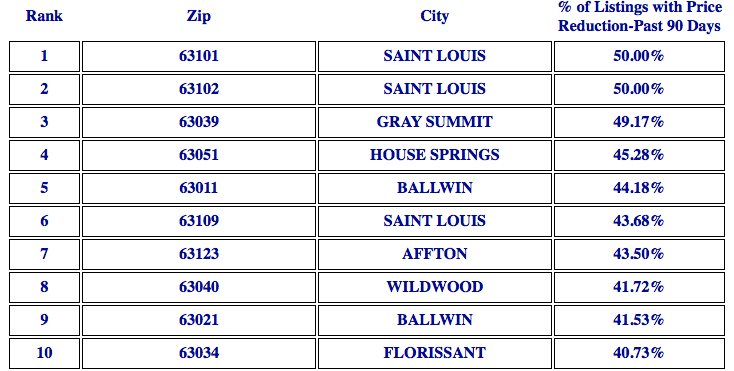
Reduced asking prices:
The table below shows the 10 St Louis neighborhoods with the highest percentage of listings where sellers have reduced their asking price at least once in the prior 90 days. This is a sign that sellers are getting impatient and perhaps realizing they have been overly optimistic about their homes value. Could very well be an indicator that a seller may take a reasonable offer.
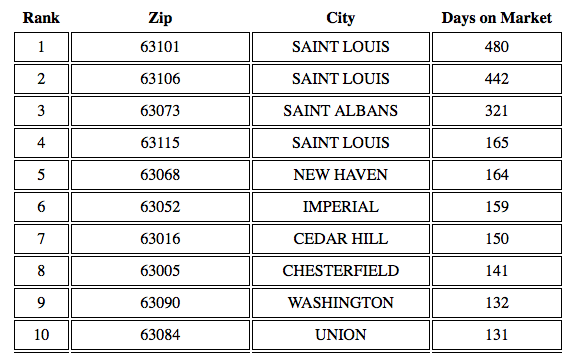
Length of time on market:
The table below shows the 10 St Louis neighborhoods where the average time the current listings have been on the market for sale is the highest. This is another indicator of a slow market and one that a seller is finally ready to take an offer that they may have turned down months ago.
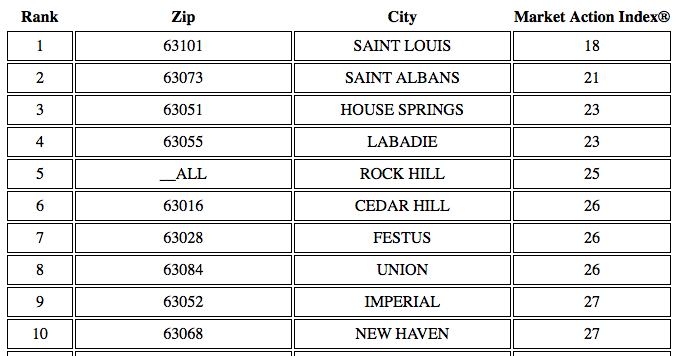
Buyers Markets:
The table below shows the 10 St Louis neighborhoods with the lowest Market Action Index which, based largely on supply and demand, indicates whether a given market is a buyers market or a sellers market. Anything below a 30 is a buyers market, above a 30 a sellers market.
So, how you find the neighborhoods where opportunities exist for good deals is to start with neighborhoods on one or more of the list above. The more of these “bad” lists the same neighborhood is on, probably the worse the market is there giving way to the opportunity for a buyer to snag a deal. Remember though, if you are an investor looking to buy something and flip it, as opposed to keep it long term, the same market indicators that showed you it was a bad market are going to be the same things that make it hard to resell!
Leave a Reply
You must be logged in to post a comment.