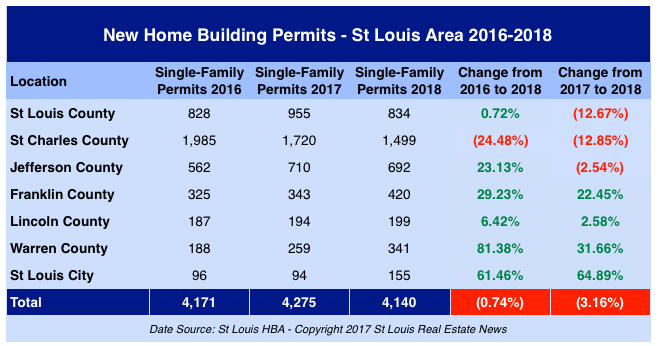
By Dennis Norman, on January 25th, 2019 There were 4,140 building permits issued for new homes in the St Louis area during 2018, a decline of 3.16% from the year before when there were 4,275 permits issued, according to information just released by the Home Builders Association of St Louis & Eastern Missouri (St Louis HBA). The number of permits issued for new homes during 2018 was just slightly down from 2016.
As the table below shows, St Charles County has seen the largest decline in new home construction with 1,499 new home permits issued in 2018, down 12.85% from the year before and decline of 24.48% from 2016 when there were 1,985 permits issued. Franklin County, Warren County and the city of St Louis all had significant double-digit gains in building permits issued during 2018 from the year before.
St Louis New Home Building Permits Issued – 2016-2018
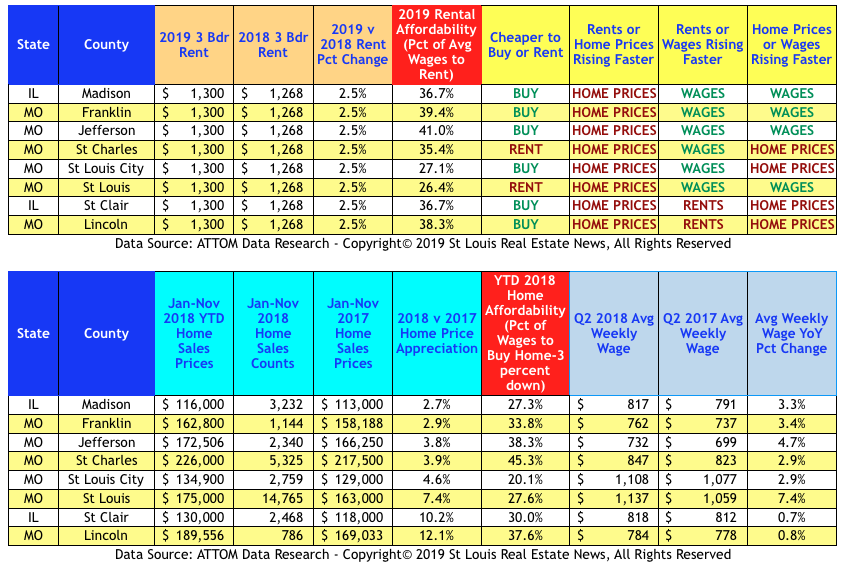
By Dennis Norman, on January 10th, 2019 According to a report just released this morning by ATTOM Data Research, it’s cheaper to buy a home than rent in 6 of 8 St Louis metro area counties covered in the report. The data reported also shows, however, that home prices are rising faster than rents in all of the counties, a trend that, if it continues, could make buying a home a less affordable option in the future. The data also shows, on a postiive note, that in 6 of 8 counties wages are rising faster than rents. The counties are split when it comes to wages vs home prices however, with wages rising faster than home prices in 4 and home prices rising faster than wages in the other 4.
Affordabilty is determined by the percentage of wages necessary to purchase a home in a given County. Based upon this criteria, the most affordable county to buy a home is the City of St Louis at 20.1%, followed by Madison County, IL at 27.3% and then St Louis County at 27.6%. The least affordable county to buy a home on the list is St Charles County at 45.3%
St Louis Home Affordability – 2018
By Dennis Norman, on December 21st, 2018 In the last week, I’ve seen several reports indicating declining home sales on both a nationwide basis as well as for the St Louis market. The reports vary widely but one local report indicated single family home sales were down 6 percent from a year ago, which, of course, should cause some concern for both agents as well as consumers since a 6 percent decline is significant. However, this is why, for this very reason, MORE, REALTORS® developed their own proprietary software to analyze and report the market data (the same MLS data as the aforementioned report was based upon) and present it in a manner that more accurately depicts the market conditions and is more applicable than many of the other reports out there.
Before I go further, I’m not picking on anyone reporting market information, as most are simply reporting the data that is available to them and doing so in a common manner which is to look at data for one specific month (in this case November) and compare it to the same month a year ago. I’m just suggesting that due to fluctuations that can be caused by, for example, weather during the month, the number of Friday’s during the month (a popular day for closings), etc. looking at a single month doesn’t paint a true picture of the market. It also matters what area the data is for, is it the St Louis MSA (which includes 8 counties in Illninois) or the city of St Louis, or some other combination?
As you will see from our STL Market Report™ tables I’ve prepared below, the St Louis real estate market is actually holding fairly steady in terms of sales when we look at the past 12-month period and compare it with the prior 12-month period. In terms of home prices, St Louis home prices have increased about 4% – 5% in the St Louis area, depending on how we look at the area.
Continue reading “St Louis Home Sales Remain Steady But Trending Downward“
By Dennis Norman, on October 4th, 2018 One of the nice things about St Louis has always been that it’s an affordable place to live and an affordable place to own a home. However, as St Louis home prices, and mortgage interest rates, continue to increase, home affordability in St Louis has declined.
As the table below, which is based on data from ATTOM Data Research, shows, all of the counties reported on in the State of Missouri saw home affordability decline during the 3rd quarter with the exception of Jackson County (Kansas City). All of the counties had a decline in home affordability from a year ago with St Louis County seeing the biggest decline at 11%.
St Louis Home Affordability – 3rd Quarter 2018

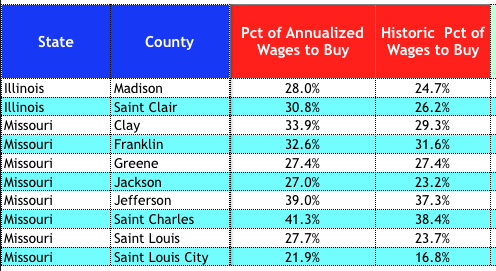
St Charles Homeowners spend the largest percentage of income on a home…
In St Charles County, home buyers spend, on average, 41.3% of their income to buy a home, the highest percentage of the reported counties in Missouri. In the city of St Louis, the percentage of income spent on housing was just 21.9%.
Percentage of Annualized Wages Necessary to Buy A Home
By Dennis Norman, on September 30th, 2018 One of the great things about living in St Louis is it is a very affordable place to live, including when it comes to home ownership. Home affordability in St Louis is certainly much better than the coasts but also beats many, if not most, metro areas. Having said that, we do have our share of expensive homes though. For example, there are currently 322 $1,000,000+ homes and condos listed for sale in the St Louis 5-county core market (City of St Louis and Counties of St Louis, St Charles, Jefferson and Franklin). The most expensive St Louis home listed for sale, at the time I wrote this article, is a home in Huntleigh listed for $7,695,000.

(Click on the image above to see complete details)
See the complete list by clicking here.
Of the 322 $1 million+ homes listed, nearly 82% of them are in St Louis County. Below is a breakdown of the listings by county:
- St Louis County – 263
- St Charles County – 25
- City of St Louis – 10
- Jefferson County – 9
- Franklin County – 15
See the list of the 30 cities in the St Louis 5-County Core market with the highest average home prices here.
[xyz-ips snippet=”St-Louis-Luxury-Homes-and-Condos—For-Sale-and-Open-House”]
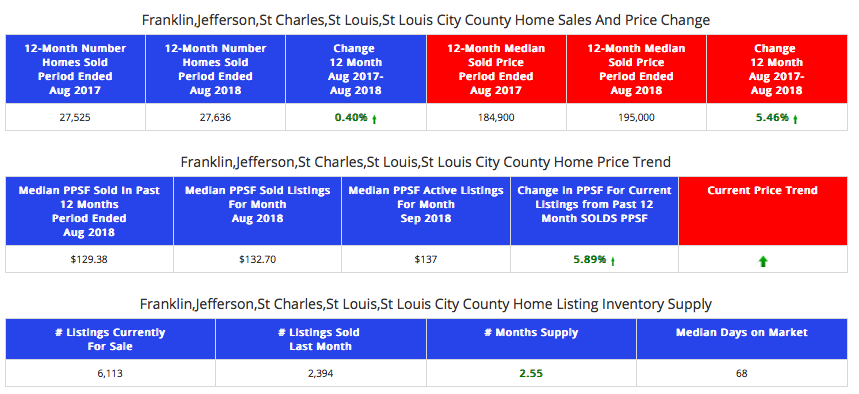
By Dennis Norman, on September 20th, 2018 St Louis home sales remain consistent but fairly flat with 27,636 homes sold during the past 12 months, just slightly more than the 27,525 homes sold in the prior 12 month period, for the 5-County core St Louis market. As the table below shows, while home sales only increased by 0.40% during the period for the core St Louis market (city of St Louis and counties of St Louis, St Charles, Jefferson, and Franklin) the median price of homes sold during the period increased 5.46% from a median price of $184,900 to $195,00. There is a currently a 2.55 month supply of homes for sale and the median time a home has been for sale in this area is 68 days.
St Louis 5- County Core Market – Home Sales and Prices
(click on table for live report)
St Louis City and County market about the same…
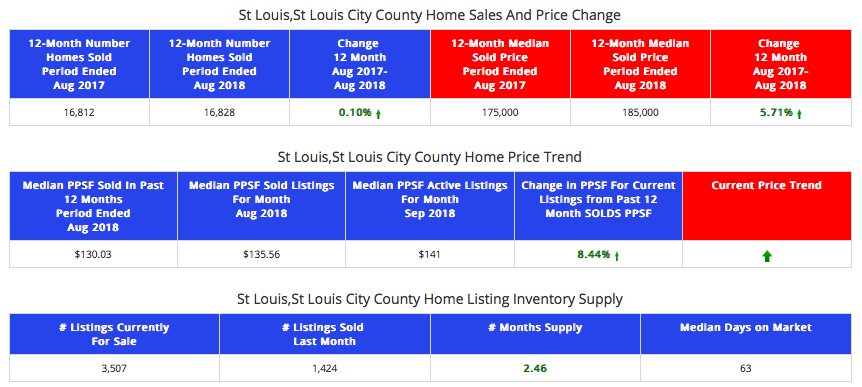
As the table below shows, the housing market in the city and county of St Louis is performing pretty much the same as for the larger 5-county area. There were 16,828 homes sold in the past 12-months in this area, which is just 16 home sales more than the prior 12-month period when there were 16,812 homes sold. The median price of homes sold in the most recent 12 month period was $185,000, a 5.71% increase from the prior 12-month period when the median home price was $175,000. There is a 2.46 month supply of homes for sale and the median time a home has been on the market for sale is 63 days.
St Louis City and County – Home Sales and Prices
(click on table for live report)
By Dennis Norman, on September 18th, 2018 Mortgage delinquency rates, the precursor to foreclosures, continue to fall as the real estate market continues to perform well. The 30-plus day mortgage delinquency rate for June 2018 fell to 4.3% of all outstanding mortgages down from 4.6% a year ago, according to a report just released by CoreLogic. Frank Nothaft, the Chief Economist for CoreLogic, attributed the good news to “A solid labor market” going on to say that June’s national unemployment rate of 4% was “the lowest for June in 18 years“.
St Louis distressed home sales falling quickly…
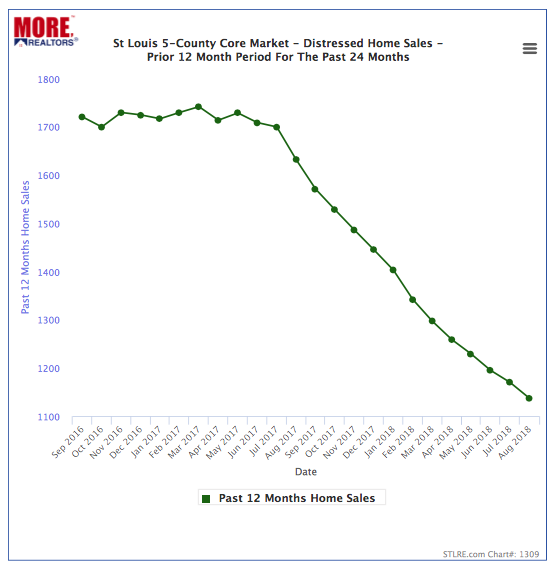
With the economy and real estate market doing so well, distressed home sales (short-sales and foreclosures) continue to decline. As our chart below shows, the 12-month trend line for distressed home sales in the 5-County core St Louis market (city of St Louis and the counties of St Louis, St Charles, Jefferson, and Franklin) fell to 1,137 sales for the 12-month period ending August 2018. This is a decline of 30% in distressed home sales in St Louis, from a year ago when there were 1,632 distressed home sales during the prior 12-month period.
[xyz-ips snippet=”Foreclosures-For-Sale-and-Homes-For-Sale”]
St Louis Distressed Home Sales -12 Month Trend – Past 24 Months
(Click on chart for live chart)
By Dennis Norman, on September 12th, 2018 Not that anyone that reads my articles on a regular basis needs any more proof of this, but there was yet another example today of just how “local” real estate is, and why it is so important to make sure you have good, accurate, up to date information before making real estate decisions. Today, the St Louis Business Journal published an article titled “St Louis among worst cities for buying a home” in which they cited a report from WalletHub that put St Louis at number 55 of 63 large cities on their list of best cities to buy a home in. The problem isn’t the ranking, as based upon the criteria used, it may very well be accurate, the problem is it really doesn’t paint a true picture of the real estate market in the St Louis area.
St Louis isn’t the “St Louis” most people are referring to…
The report was based upon data from the city of St Louis which I think most everyone knows has been on the decline population-wise for a long time now and has more challenges with the unemployment rate, median income, average credit scores as well as some of the other areas used in the report to rank the city. However, when locals, as well as many outsiders, talk about “St Louis” they are really referring to the whole, St Louis City and County area, not just the city.
Given that the city of St Louis has a population of just 311,404 people, and that is less than a quarter (23.7%) of the overall St Louis City and County combined population of 1,314,404 people, the St Louis portion of our real estate market is a very small, not so significant part of the market. Contrast this with Kansas City, Missouri where the city has 70% of the population of the county it is located in. Therefore, when Kansas City is ranked based upon the city of Kansas City’s real estate market, it is a much truer representation of the overall market there.
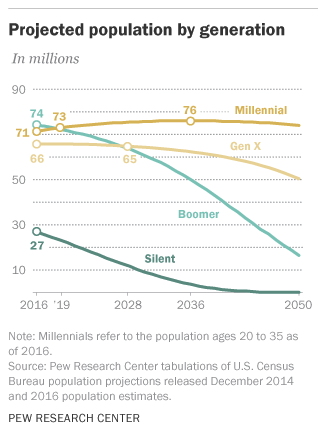
By Dennis Norman, on July 23rd, 2018 The millennial generation, people born from 1981 through 1994, is predicted to outnumber the baby boomer generation sometime in 2019. Given the size of the generation, as well as the fact many are getting married and starting families, the real estate industry is very interested in these young people. Much time is spent trying to figure out whether they want to buy or rent, whether they will consider the suburbs or just stick to urban areas, etc.
Therefore, it does not come as a surprise that more than a third of the residents in the city of St Louis are millennials, attracted, no doubt, by the city lifestyle, a sharp contrast from the suburban upbringing many of them had with their baby boomer parents. However, the tides may be turning though.
As the table below shows, during 2017 the millennial population in the city of St Louis dropped by 1.4% while St Charles County grew by 1.0% and St Louis and Jefferson County by 0.3% each. As of 2017, the city of St Louis had 105,900 millennials living there, while St Charles County had 103,500, but if the trend continues, the millennial population in St Charles County will surpass the city of St Louis soon. Who knows? Maybe the millennials are more like us baby boomers than we thought and will end up buying homes in suburbia?
St Louis Area Millennial Population and Population Change – 2017

Projected Population by Generation
By Dennis Norman, on July 10th, 2018 Home sales in St Louis declined a little over 2 percent during the most recent 12-month period from the prior period while the median price of homes sold in St Louis rose 4.4%, according to the latest data from MORE, REALTORS.
St Louis home sales are trending downward slightly as well, as illustrated by the chart below. The light green line depicts year to date home sales for the St Louis 5-county core market (city of St Louis and counties of St Louis, St Charles, Jefferson and Franklin) and reveals that through June of this year, there have been 13,237 homes sold and, at the same time last year, 13,466, a decline of 1.7% in year to date sales.
St Louis 5-County Home Sales & Home Prices
(click on the table below for live report and complete data)

St Louis 5-County Core Market YTD & Past 12 Months Home Sales

By Dennis Norman, on July 5th, 2018 Nearly 80 percent (78.8%) of the homeowners with a mortgage in St Charles County spend less than 30% of their household income for gross monthly housing costs, according to the U.S. Census Bureau’s latest data. As the table below shows, the 4-largest St Louis area counties are all within the green (good) level for housing affordability in all categories: Homeowners with a mortgage, homeowners without a mortgage and renters.
Of the three categories, St Louis renters have the worst housing affordability threshold with a median of 46.3% of St Louis renters spending more then 30% of their household income on housing costs. Conversely, a median of just 25.6% of St Louis homeowners with a mortgage, spend more than30% of their household income on housing costs.
Of the four counties reported on in the table below, residents of the city of St Louis fare the worst in all 3 categories in terms of their housing affordability threshold.
St Louis Area Housing Affordability Threshold
Source: NACo Analysis of U.S. Census Bureau – American Community Survey (ACS) 5 year estimates, 2016
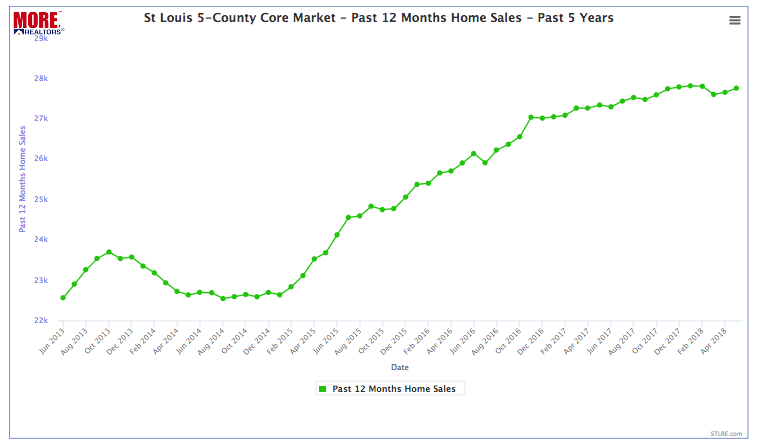
By Dennis Norman, on June 25th, 2018 Homes have sold in the St Louis area at an increasing rate for a little more than 3 years now, however, as the chart below illustrates, the trend is flattening. The chart below, which was created from software our firm developed which compiles data from the MLS, plots homes sales for the past 12 months for each month. So, rather than just seeing the activity for one month and all the seasonal fluctuation, you can actually see the sales trend.
Since March 2015, the 12-month home sales trend has steadily increased at a fairly steady pace however, it appears we may have hit the ceiling. For the 12-month period ended May 31, 2018, there were 27,755 homes sold in the St Louis 5-County Core market (city of St Louis and counties of St Louis, St Charles, Jefferson and Franklin) a very slight increase over the 12-month period ended April 2018 when there were 27,653 homes sold and just a 1.5% increase from a year ago when there 27,339 homes sold in the prior 12-month period.
St Louis 5-County Core Market- 12-Month Home Sales Trend – Past 5 Years
(click chart for live chart and table)
By Dennis Norman, on June 21st, 2018 The St Louis 5-county core had a total population of 2,027,996 in 2017, up from 2,000,405 in 2010. The population increase os 27,591 represents a very modest population increase of just 1.36% for the 7-year period, according to the latest date from the U.S. Census Bureau. As the table below shows, the number of Asian people in St Louis grew by 11,913 during the period, an amount equal to 43% of the total St Louis population growth.
The St Louis 5-county core consists of the city of St Louis and the counties of St Louis, St Charles, Jefferson and Franklin. As shown below, three of the five counties experienced a growth in population from 2010 to 2017 with St Charles having the greatest growth at over 8.5%. The city of St Louis experienced the largest population decline with a loss of about 3.5% of its population during the 7-year period.
Another interesting tidbit in the data below is the growth in the male population in the St Louis 5-county core. During this period, the male population increased by 1.6% while the female population increased just 1.14%. While it may seem that significant, that is a 40% higher growth rate for males.
Continue reading “St Louis Area Population Growth Nearly Flat But Asians and Males on The Rise“
By Dennis Norman, on June 6th, 2018 The five counties I refer to as the “St Louis Core Market“, which include the city of St Louis and counties of St Louis, St Charles, Jefferson and Franklin, account for over 90% of the home sales in the 9 Missouri Counties that are part of the St Louis MSA. This is why I typically focus on those five counties when reporting real estate market stats as they give the “big picture” view of the St Louis market but in a more accurate way than the St Louis MSA stats.
The counties making up the St Louis core market vary significantly in everything from socioeconomics and demographics to housing style, quality of public schools and home prices. As a result, the counties respond somewhat differently to market conditions, whether good or bad. To show how they compare, I produced a chart depicting home sales and price trends for the past 3 years. Which county fared the best over the past few years depends on which market statistic we rank them on.
Franklin County is the clear winner for home sales trend….
As the first chart below illustrates, the home sales trend for Franklin County has been the best, with a 39% increase over the past 3 years. For the 12-month period ended June 2015 there were 889 homes sold in Franklin County and for the 12-month period ended May 2018, there were 1237 homes sold.
St Louis City and St Charles County are at the top for home price appreciation…
The bottom chart reflects the median price per foot for the homes sold in each county and shows that, over the 3-year period, the city of St Louis had the highest increase in home prices at 13.9% followed by St Charles County with a 12.7% increase. Interestingly enough, Franklin County, with the largest increase in home sales, had the second-lowest increase in home prices during the period. (We work hard on this and sure would appreciate a “Like”)[iframe http://www.facebook.com/plugins/like.php?href=https%3A%2F%2Fwww.facebook.com%2FStLouisRealEstateNews&send=false&layout=standard&width=50&show_faces=false&font&colorscheme=light&action=like&height=35&appId=537283152977556 100 35 ]
Continue reading “Home Sales And Price Trends Between St Louis Area Counties“
By Dennis Norman, on May 29th, 2018 Typically, Franklin County and Jefferson County home sales stats tend to lag behind their “closer in” neighbors of St Louis and St Charles County, however, when it comes to fastest-selling zip codes, the two outlying counties claim the number 1 and number 2 spots, respectively. As the table below shows, homes in the 63072 zip code area (Robertsville) of Franklin County are selling the fastest, based upon average days on market of existing listings which stands at 24 days as of this morning. With an average time on the market of 33 days, the High-Ridge area zip of 63049 in Jefferson County comes in at #2.
Of the top-ten fastest selling zip-codes, 5 are in St Louis County, 2 in Jefferson County, and then 1 each in Franklin and St Charles County as well as the city of St Louis.
(We work hard on this and sure would appreciate a “Like”)[iframe http://www.facebook.com/plugins/like.php?href=https%3A%2F%2Fwww.facebook.com%2FStLouisRealEstateNews&send=false&layout=standard&width=50&show_faces=false&font&colorscheme=light&action=like&height=35&appId=537283152977556 100 35 ]
[xyz-ips snippet=”All-Solds—Even-Jefferson-and-Franklin”]
Continue reading “Jefferson & Franklin County Zips Move To Top of Fastest Selling Zip Code List“
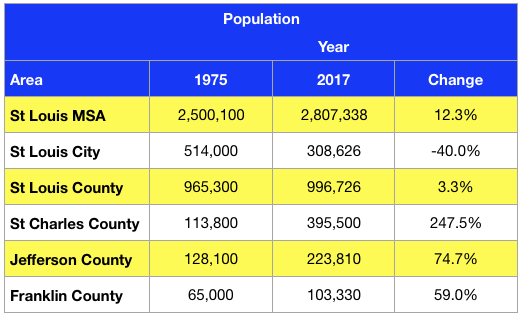
By Dennis Norman, on May 17th, 2018 The St Louis metro area has seen some population growth over the last few decades but not nearly as much as many other areas. From 1975 until last year, the population of the St Louis MSA increased 12.3% from 2,500,100 in 1975 to 2,807,338 in 2017. Of the major counties in Missouri that make up the St Louis MSA, St Charles County gained the most population increasing 248% during the same period. As the table below shows, 4 of the 5 major counties covered saw an increase in population from 1975 to 2017, although St Louis County’s increase was a rather lackluster 3.3%. Even St Louis County’s modest increase looks good when compared with the city of St Louis that lost 40% of its population during the period.
City of St Louis’ loss is St Charles County gain…
As the table below illustrates, St Charles County gained 281,700 people from 1975 through 2017 while the city of St Louis lost 205,474. Granted, not everyone that left the city of St Louis moved to St Charles County, but there is a lot of “shuffling of the population” that occurs here with movement from one area to another within St Louis as the population shifts. As a result, we end up with things such as the triple-digit increase in population in St Charles County and the city of St Louis losing nearly half of its population, while the overall metro area just had a modest gain.
How we compare to others…
To see how St Louis fared with other similar-sized areas, I checked the population history for the Davidson County Tennessee (Nashville) and Mecklenburg County North Carolina (Charlotte). Below is what I found:
- Davidson County TN – 49.5% population growth from 1975 to 2017 increasing from 462,600 to 691,243.
- Mecklenburg County NC – 185% population growth during the same period increasing from 377,400 to 1,076,837
So, while smaller, St Charles, Jefferson, and Franklin County’s population growth outpaced Davidson County and just St Charles County managed to outperform Mecklenburg County.
In the coming days, I’ll take a look at how population change has affected home prices and sales.
(We work hard on this and sure would appreciate a “Like”)[iframe http://www.facebook.com/plugins/like.php?href=https%3A%2F%2Fwww.facebook.com%2FStLouisRealEstateNews&send=false&layout=standard&width=50&show_faces=false&font&colorscheme=light&action=like&height=35&appId=537283152977556 100 35 ]
St Louis Population – 1975 – 2017
(click on the table below for live charts showing complete data for each area)
By Dennis Norman, on July 6th, 2017 Yesterday, I did an article about the population shift in St Louis in which I included data showing the the city of St Louis has lost population every year for the past six years (the period covered in my article) while St Charles County and Jefferson County experienced population growth every year during the period. So, today, I decided to see what has happened with regard to home values in these counties and whether anything value-wise seems tied to the population shift.
Below is a 10-year chart, showing the median price per foot (one of the most accurate ways to look at home prices) for each of the 5-counties that make up the St Louis core-market. As the chart reveals, there doesn’t necessarily seem to be any correlation between home appreciation and population shift. Below is a quick analysis:
(We work hard on this and sure would appreciate a “Like”)[iframe http://www.facebook.com/plugins/like.php?href=https%3A%2F%2Fwww.facebook.com%2FStLouisRealEstateNews&send=false&layout=standard&width=50&show_faces=false&font&colorscheme=light&action=like&height=35&appId=537283152977556 100 35 ]
Search St Louis Homes For Sale HERE
See ALL Homes That Will Be Open In St Louis This Weekend
Find the value of your home (or any home) online in under a minute!
Continue reading “Is There a Connection Between St Louis Population Shift and Home Prices?“
By Dennis Norman, on July 5th, 2017 Recently, the U.S. Census Bureau released the 2016 population estimates revealing that the city of St Louis continues to lose residents while outlying counties like St Charles, Jefferson and Franklin grow and St Louis county remains relatively stagnant.
As the table below shows, over the past 6 years the city of St Louis population declined almost 2.5% while St Charles County grew by nearly 8.5%. Both St Charles County and Jefferson County have enjoyed annual growth in population since 2010 while Franklin County grew every year but one. St Louis County has followed a different pattern than the rest with 3 years of growth, a small decline in 2014, 2015 went back to 2013 levels nearly then 2016 gave up everything gained in the prior years falling back to a population lower than in 2010. St Louis city has continued to decline in population year after year for the periods shown.
(We work hard on this and sure would appreciate a “Like”)[iframe http://www.facebook.com/plugins/like.php?href=https%3A%2F%2Fwww.facebook.com%2FStLouisRealEstateNews&send=false&layout=standard&width=50&show_faces=false&font&colorscheme=light&action=like&height=35&appId=537283152977556 100 35 ]
Search St Louis Homes For Sale HERE
See ALL Homes That Will Be Open In St Louis This Weekend
Find the value of your home (or any home) online in under a minute!
St Louis Population Trends 2010-2016

By Dennis Norman, on July 4th, 2017 It’s good when the value of your home increases, right? Yes, generally, most homeowners, look at their homes as an investment in addition to shelter for their families so they are generally happy to see the value of their investment increase. The flip side of it is, homebuyers, particularly first-time buyers, would, of course, like to see lower prices and better value in the home they buy. The thing that helps balance out these competing interests is inflation, but more specifically, the rate of income growth.
Not to get into an economics lesson here (which I’m not qualified to teach anyway) but if homebuyers incomes increase at about the same rate as home prices (ditto for interest rates) then, more or less, the “affordability” of a home to a buyer remains the same. Problems arise when those things get out of whack, such as in the period from about 2000 through 2007 when home prices were increasing at a much higher rate than incomes were (and interest rates rose too making it even more fun) which eventually led to the housing bubble burst in 2008 and the real estate market crash.
(We work hard on this and sure would appreciate a “Like”)[iframe http://www.facebook.com/plugins/like.php?href=https%3A%2F%2Fwww.facebook.com%2FStLouisRealEstateNews&send=false&layout=standard&width=50&show_faces=false&font&colorscheme=light&action=like&height=35&appId=537283152977556 100 35 ]
Search St Louis Homes For Sale HERE
See ALL Homes That Will Be Open In St Louis This Weekend
Find the value of your home (or any home) online in under a minute!
Continue reading “City of St Louis Has Best Home Affordability In St Louis Area“
By Dennis Norman, on June 12th, 2017 In the real estate community there are frequent discussions about the millennial’s and their impact on the real estate market. Since their generation makes up the largest share of the population presently, their interest, or lack thereof, in homeownership definitely has the attention of us in the real estate industry. The consensus among many in the real estate industry is that millennials don’t value homeownership as much as their baby boomer parents did, and do, however, they don’t necessarily have anything against the idea. The millennial generation seems to be more driven by lifestyle and flexibility than whether or not they own where they live.
With this in mind, today I wanted to look at the median age of the city of St Louis as well as the surrounding counties to see where the younger people are migrating as well as look at the homeownership rates for those areas. While I don’t know that there is a relationship between the median age of an area and the homeownership rate necessarily, there well could be.
The City of St Louis is where the young people are…
As the map below shows, the city of St Louis, with a median age of it’s population of 34.6 years, has the youngest population followed by St Charles county with a median age of 37.4 years.
The City of St Louis has the lowest homeownership rate by far…
As the second map below shows, the city of St Louis also has the lowest homeownership rate at 47.8%, however, St Charles County, the county with the second youngest median age has one of the highest homeownership rates in the area at 81.34%.
(We work hard on this and sure would appreciate a “Like”)[iframe http://www.facebook.com/plugins/like.php?href=https%3A%2F%2Fwww.facebook.com%2FStLouisRealEstateNews&send=false&layout=standard&width=50&show_faces=false&font&colorscheme=light&action=like&height=35&appId=537283152977556 100 35 ]
Search St Louis Homes For Sale HERE
See ALL Homes That Will Be Open In St Louis This Weekend
Find The Value Of Your Home In Under A Minute!
Continue reading “The City Of St Louis Has Youngest Population and Lowest Homeownership Rate In Area“
By Dennis Norman, on May 31st, 2017 From the outset I need to admit that this is probably a pointless article as the mindset of someone that would want to buy a luxury home ($750,000+) in St Louis County is quite different than someone that would want to buy one in the city of St Louis, and vice versa, so neither will probably be swayed in their preference by which location offers a better return on their investment. Having said that, I still thought it would be interesting to examine the market and see how luxury home buyers have fared over the years in both locations.
St Louis County Luxury Home Buyers Fared Much Better Over Past 10 Years Than St Louis City Buyers
As our 10-year chart below shows, luxury home prices (homes that sold for $750,000 or above) have done much better in St Louis County, with the median price per foot represented on the chart below by the yellow line, than they have done in the City of St Louis (brown line). The median price per square foot (the most accurate way to compare home prices) for luxury homes sold in St Louis County during 2007 was $230 and in 2017 luxury homes have sold in St Louis County thus far at $244 per square foot, an increase of 6.1% from 10 years ago. For the city of St Louis, luxury homes sold for a median price of $185 per square foot in 2007 and for 2017 have sold for a median price of $152 per square foot, a decline of 21.7% from 10 years ago. As the chart illustrates so dramatically, St Louis county luxury home prices were not impacted by the market crash of 2008 nearly as much as in the city of St Louis.
(We work hard on this and sure would appreciate a “Like”)[iframe http://www.facebook.com/plugins/like.php?href=https%3A%2F%2Fwww.facebook.com%2FStLouisRealEstateNews&send=false&layout=standard&width=50&show_faces=false&font&colorscheme=light&action=like&height=35&appId=537283152977556 100 35 ]
Search St Louis Homes For Sale HERE
See ALL Luxury Homes For Sale
See ALL Luxury Condos For Sale
See ALL Luxury Homes With Open Houses This Weekend
Continue reading “Is It Better To Invest In a Luxury Home In St Louis County or City?“
By Dennis Norman, on May 23rd, 2017 It is common for home buyers, particularly those moving to St Louis from outside the area or perhaps moving to a different part of town than where they currently reside, to inquire about crime rates and other safety issues related to the area they are looking to move to. Today, like pretty much every other topic out there, there is a wealth of information available on the internet with regard to crime activity however sometimes it is difficult to find real data and not just “headlines” from local news stories or social media posts. Therefore, in keeping with our mission of providing up to date, accurate and trustworthy information that is relevant to homeowners, as well as buyers and sellers, we developed our own Index to make it easier to people to evaluate an area. Since we are in the real estate business and the people we are providing this information for are interested in home values, we wanted to have our index consider both crime rates as well as home price appreciation. As a result, our Home Appreciation & Safety (HASTM) Index was born.
The crime data we use comes from the Uniform Crime Reporting Report from the Missouri Highway Patrol for the year 2016 for violent crime and property crime, the population numbers from the U.S. Census Bureau and the home price data from STL Market Reports. For our Home Appreciation & Safety (HASTM) Index, we multiply the median home price change by the rate of violent crime. Since the larger the crime rate number is (in terms of 1 violent crime per X number of people) the safer the area is, and the higher the home price change, the more appreciation there is, so when multiplying these together the higher the ending index number is, the better.
City of Ballwin With Low Crime Rate and Good Home Appreciation Tops List For Home Appreciation & Safety (HASTM) Index
Of the cities reviewed and shown on the table below, Ballwin had the lowest rate of crime per capita for both violent crimes and well as property crimes with rates of 1 in 2,780 and 1 in 128 respectively. Add to that Ballwin’s above-average home price appreciation over the past 12 months of 7.20% and the result is a 200.14 on our Home Price Appreciation/Safety (HASTM) index. This gives Ballwin the highest index on our list making it perhaps the best place on the list to invest in a home. Coming in a distant second is the city of Creve Coeur with an index of 116.97.
(We work hard on this and sure would appreciate a “Like”)[iframe http://www.facebook.com/plugins/like.php?href=https%3A%2F%2Fwww.facebook.com%2FStLouisRealEstateNews&send=false&layout=standard&width=50&show_faces=false&font&colorscheme=light&action=like&height=35&appId=537283152977556 100 35 ]
See All Ballwin Homes Currently For Sale
See All The Ballwin Open Houses Scheduled For This Weekend
Homes Sold In Ballwin In Past Year With Actual Sold Prices
Ballwin Home Price and Sales Data – Live Current Report
Find the Value of Your Ballwin Home Online NOW! (or any other home) Continue reading “Ballwin Tops List On Home Appreciation & Safety Index“
By Dennis Norman, on April 25th, 2017 As the chart below shows, there were 2,880 homes sold last month within the 5-county core St Louis market (city of St Louis and counties of St Louis, St Charles, Jefferson and Franklin) an increase of 6.5% from March 2016 when there were 2,705 homes sold. Looking at a the year over year change for a single month of home sales doesn’t usually tell the complete story, so I like to look at the prior 12 month period and compare it to the prior 122 month period to get the “big picture”. When we do that for the 5-county core St Louis home market, as the table below shows, there were 27,437 homes sold in the 12 month period ending March 31, 2017, an increase of 6.26% from the prior 12 month period when there were 25,821 homes sold.
St Louis Home Prices Increased 6.5% in March from year ago
The chart below also reveals that the median price of homes sold last month in the St Louis core market was $166,380, an increase of 6.5% from March 2016 when the median price was $156,250. Looking at the table for the most recent 12 months we see the median price of homes sold was $180,000 ,an increase of 5.26% from the prior 12 month period when the median price of homes sold was $171,000.
(We work hard on this and sure would appreciate a “Like”)[iframe http://www.facebook.com/plugins/like.php?href=https%3A%2F%2Fwww.facebook.com%2FStLouisRealEstateNews&send=false&layout=standard&width=50&show_faces=false&font&colorscheme=light&action=like&height=35&appId=537283152977556 100 35 ]
Search St Louis Homes For Sale HERE
See ALL Homes That Will Be Open In St Louis This Weekend
Find The Value Of Your Home In Under A Minute!
Continue reading “St Louis Home Sales Increase in March“
By Dennis Norman, on April 11th, 2017 The supply of homes for sale in St Louis continues to fall making it even more of a challenge for the home buyers out there while making it pretty easy on sellers. For the past couple of years we have seen homes, that were properly priced and marketed correctly, sell often on the first day, or within the fist few days, of coming on the market for sale. In fact, more and more it’s become common for homes to sell before actually even hitting the market officially. Judging by the market stats, it’s probably not going to get any better for buyers anytime in the near future.
5 County Core Market Sees 2nd Lowest Supply in over 10 years…
As the chart below shows, the St Louis 5-county core market in March dropped to a 2.5 month supply of homes for sale, the 2nd lowest level in over 10 years. Back in June, 2016, the supply of homes for sale dropped to 2.37 months.
Jefferson County supply of homes for sale drops to its lowest level in over 10 years…
As of March, there was a 3.17 month supply of homes for sale in Jefferson County, down from 5.5 months the month before and the lowest level in over 10 years.
St Louis City/County, St Charles and Franklin Counties’ supply of homes for sale all near record lows…
Franklin County, with a 4.10 month supply of homes for sale, is at it’s 2nd lowest level in over 10 years, St Louis City/County, at 2.47 months, is at the 3rd lowest level in over 10 years and St Charles, at 1.91 months, is at its 4th lowest level in over 10 years.
(We work hard on this and sure would appreciate a “Like”)[iframe http://www.facebook.com/plugins/like.php?href=https%3A%2F%2Fwww.facebook.com%2FStLouisRealEstateNews&send=false&layout=standard&width=50&show_faces=false&font&colorscheme=light&action=like&height=35&appId=537283152977556 100 35 ]
Search St Louis Homes For Sale HERE
Sell your house fast, for the highest price and pay as little as 3.95% total commission!
Find The Value Of Your Home In Under A Minute!
Continue reading “Supply Of Homes For Sale In St Louis Hits Record Lows In March“
By Dennis Norman, on March 20th, 2017 The median price of homes sold in the St Louis core housing market (city of St Louis and counties of St Louis, St Charles, Jefferson and Franklin) was $179,900 for the past 12 months, an increase of 5.2% from the prior 12 month period when the median price of St Louis homes sold was $171,000. There were 27,323 homes sold during the past 12 months, an increase of 7.59% from 25,395 from the prior 12 month period. As the table below shows, there are currently 5,180 active home listings in the St Louis core market, which, based upon current sales rates, is just a little over a 3 month supply.
Year over year home sales and prices for February
During the month of February 2017, as the chart below shows, there were 1,496 homes sold in the St Louis core market sold at a median price of $167,000.00, just a slight increase in home sales from February 2016 when there were 1,481 homes sold and an increase of 3.7% in price from the median price of $161,000.00 homes sold for in February 2016.
(We work hard on this and sure would appreciate a “Like”)[iframe http://www.facebook.com/plugins/like.php?href=https%3A%2F%2Fwww.facebook.com%2FStLouisRealEstateNews&send=false&layout=standard&width=50&show_faces=false&font&colorscheme=light&action=like&height=35&appId=537283152977556 100 35 ]
Search St Louis Homes For Sale HERE
See ALL Homes That Will Be Open In St Louis This Weekend
Find The Value Of Your Home In Under A Minute!
Continue reading “St Louis Home Prices Increase Over 5 Percent In Past 12 Months; Sales up over 7 percent“
By Dennis Norman, on March 20th, 2017 There just aren’t enough homes for sale in many price ranges! This month, like many months before, you will see that all five counties in the St Louis core market (city of St Louis and the counties of St Louis, St Charles, Jefferson and Franklin) all have less than a 6 month supply of homes for sale (a few less than half of that), so it remains a sellers market in many areas! While the market is doing well, you will notice the trend over the past 24 months, as I describe in the video is down a little in terms of number of homes sales which is due simply the lack of homes available for sale. There doesn’t appear to be a shortage of buyers at this point, just a shortage of sellers.
Whether you are thinking of buying or selling and would like me to look at your situation and your market to determine the best strategy, just call, or text me, at 314.332.1012 and I’ll be happy to help!
Sell Your Home For The Highest Price In The Least Amount of Time! See how- STLSellersAdvantage.com
Save Commission On Your Home Sale Without Sacrificing Service! See how– FairCommissionRate.com
Thinking of selling and want to know if your neighborhood is a seller’s market? Contact us and we’ll answer that question for you.
Continue reading “St Louis Real Estate Market Update VIDEO – March 2017“
By Dennis Norman, on March 19th, 2017 The percentage of people in St Louis with a sub-prime credit score (below 660) has continued to improve since peaking in most St Louis area counties around 2008, according to the latest data released by Equifax. As the interactive map below shows, 30.63% of the people in the city of St Louis had sub-prime credit in the 4th quarter of 2016. This is a decline from the 4th quarter of 2008 when it was 38.42% and even down from 2006, the year of the peak of the St Louis housing market, when 34.21% of people in the city of St Louis had sub-prime credit.
As the map shows, from the 5-county core St Louis market, St Charles County has the lowest percentage of sub-prime borrowers at 21.07%. From the entire St Louis metro area, Monroe County in Illinois has the lowest percentage of sub-prime borrowers at 16.11%. At the other end of the spectrum, the city of St Louis has the highest percentage of sub-prime borrowers from within the 5-county core St Louis market and Washington County, at 35.09%, has the highest percentage of people with sub-prime credit in the St Louis MSA.
(We work hard on this and sure would appreciate a “Like”)[iframe http://www.facebook.com/plugins/like.php?href=https%3A%2F%2Fwww.facebook.com%2FStLouisRealEstateNews&send=false&layout=standard&width=50&show_faces=false&font&colorscheme=light&action=like&height=35&appId=537283152977556 100 35 ]
Search St Louis Homes For Sale HERE
See ALL Homes That Will Be Open In St Louis This Weekend
Find The Value Of Your Home In Under A Minute!
Continue reading “Percentage of St Louisans With Sub-Prime Credit Has Improved to Pre-Housing Bubble Levels“
By Dennis Norman, on March 11th, 2017 The St Louis downtown loft market had a slow start back in the early 90’s and then picked up some steam later in the 90’s after Missouri launched its historic tax credit program which gave developers another tool to use to make loft projects more financially feasible. The loft market, as the chart below illustrates, peaked in 2005, stalling out before the majority of the residential hit its peak in 2006. The St Louis loft market saw a kind of double peak with prices rising in 2007 after dipping the year before, but then loft prices followed suit with the rest of the market and started a long slow decline until hitting bottom in 2011.
In looking at the St Louis downtown loft district market from 2002 through the end of last year, as depicted on the chart below, you can see that loft prices, while they have increased from the bottom reached after the housing bubble burst in 2008, have not recovered to pre-bubble levels, not even back to 2002 levels. The median price of St Louis downtown loft district lofts sold in 2002 was $192,975 in 2002, rose to a peak of $236,000 during 2005, dipped down to $205,505 during 2006 however, it should be noted, that the number of lofts sold peaked during 2006, hitting 131 sales, the highest level for the entire 15 year period covered here. St Louis loft prices then hit the second highest level in 2007 with a median price of $209,000, however, there were only 51 lofts sold that year, less than half the year before. Loft prices then continue to tumble until hitting bottom in 2011 at $128,250 with only 34 lofts sold that year. Last year, there were 71 lofts sold at a median price of $152,000. To recap, for the loft market, 2016 prices were just 19% higher than the bottom reached in 2011 and 36% lower than the peak in 2005. Loft prices in 2016 were 21% lower than the 2002 median price of $192,875.
(We work hard on this and sure would appreciate a “Like”)[iframe http://www.facebook.com/plugins/like.php?href=https%3A%2F%2Fwww.facebook.com%2FStLouisRealEstateNews&send=false&layout=standard&width=50&show_faces=false&font&colorscheme=light&action=like&height=35&appId=537283152977556 100 35 ]
See All The Lofts For Sale and Rent In St Louis at StLouisLofts.com
Live, Interactive Map of St Louis Downtown Loft District Lofts For Sale
Lofts That Will Be Open This Weekend Continue reading “Downtown St Louis Loft District Offers Value Priced Lofts“
By Dennis Norman, on February 19th, 2017 Investors that rental property may find their best returns, relative to the price of the homes they buy, in the City of St Louis, according to some county-level rental data compiled by MORE, REALTORS. As the tables below illustrate, over the past 12 months the median price of homes sold in the City of St Louis was $106.57 per square foot and the median annualized price per foot homes lease for was $11.04 which works out to a gross annual return on investment of 10.4% in the City of St Louis, the highest of the four St Louis area counties we looked at. The next best return is found in Jefferson County with a 9.8% return, followed by St Charles County at 9.3% and finally, St Louis County, at 9.1%.
Data limitations…
There is an excellent source of very accurate market data available with regard to prices of homes sold, that being the REALTOR MLS which is where our sold data comes from. One of the reasons this data is so accurate is because the lions share of homes sold in St Louis are done through REALTORS and the data that is reported on those sales to the MLS is subject to strict guidelines and rules to insure accuracy. When it comes to rental and lease data however, the data is much harder to assimilate. This is because the majority of rentals are leased without the assistance of REALTORS and therefore the lease data does not make it’s way to the MLS and there really is no other reputable data source available for it. When it comes to rental data for larger apartment complexes and the like, there is such data available, but not for single family homes. Therefore, we have worked to produce rental data from the leases that are handled by REALTORS. As you can see from the tables below, the number of leases reported in the MLS is much smaller than sales (1,283 vs 13,330 for St Louis County for example) however, there are enough reported I believe to make the data statistically significant.
We can drill it down more…
We can drill down the data to a more local level, such as at the school district, city or zip level, and do this for our investor clients, but what I’ve compiled here gives an overall view of the market at the county level. Another thing I suggest investors evaluate as well before investing their money, is the appreciation rate of homes in that area. This is data we also compile and, when you put the rental return rate data next to the price appreciation data you get a pretty good picture of the areas that make the most overall sense to invest in.
(We work hard on this and sure would appreciate a “Like”)[iframe http://www.facebook.com/plugins/like.php?href=https%3A%2F%2Fwww.facebook.com%2FStLouisRealEstateNews&send=false&layout=standard&width=50&show_faces=false&font&colorscheme=light&action=like&height=35&appId=537283152977556 100 35 ]
Search St Louis Homes For Sale HERE
How to Buy Foreclosures – Advice From a 2,000+ Home Investor
Find The Value Of Any Home In Under A Minute!
Continue reading “Landlords Get Best Return With Rentals In City Of St Louis“
By Dennis Norman, on February 14th, 2017 While the bulk of the St Louis area spent most of the past year as a sellers market, real estate is very local and very seasonal, so there are still neighborhoods where buyers markets exist! So where are the buyers markets? Well, they are a constantly moving target due to the fluctuations I just mentioned, however, currently, as the list below illustrates, 6 of the top ten buyers market neighborhoods are in St Louis County, with the tony town of Frontenac at the top of the list where there exists a 23 month supply of homes for sale, two are in St Charles County, two in Jefferson County and none are from Franklin County or the City of St Louis.
(We work hard on this and sure would appreciate a “Like”)[iframe http://www.facebook.com/plugins/like.php?href=https%3A%2F%2Fwww.facebook.com%2FStLouisRealEstateNews&send=false&layout=standard&width=50&show_faces=false&font&colorscheme=light&action=like&height=35&appId=537283152977556 100 35 ]
Search St Louis Homes For Sale HERE
See ALL Homes That Will Be Open In St Louis This Weekend
Find The Value Of Your Home In Under A Minute!
Continue reading “Top Ten Buyers Markets In St Louis“
|
Recent Articles
|


