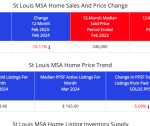
St Louis Real Estate Market Report for May 2023 with accurate data you can trust

Below is the St Louis Real Estate Market Report for May 2023 for the City and County of St Louis combined from St Louis Real Estate Search (the Official site).    You can access the full infographic, containing data for St Charles, Jefferson and Franklin Counties as well by clicking on the image below.

In this competitive market don’t make decisions based upon bad data!

Today’s real estate market is unforgiving for homebuyers, driven by a scarcity of inventory and robust buyer demand. This, coupled with not just bidding wars but “terms wars”, has made it challenging for many. In an effort to stand out, homebuyers are waiving contingencies from their offers and pushing their budgets to the limit. Quite often, these buyers are willing to pay more than the actual worth of the property. As I previously addressed in my article, “Are Homebuyers Today Grossly Overpaying for Homes and Making Decisions They’ll Regret?“, this approach is acceptable, provided it’s a well-informed decision.

To make such decisions, you need accurate data and an experienced, professional agent who can interpret that data and apply it to your unique situation. This is why I take immense pride in our team at MORE, REALTORS®. Our agents are skilled professionals who can guide both buyers and sellers through the intricacies of the current market to a successful outcome.

To support our agents and clients, I invest considerable time in gathering, scrutinizing, and reporting on market information and data. I aim to provide the most precise data possible to empower smart, informed decision-making. While it’s true that no data can be 100% accurate in all respects, getting as close to that ideal as possible improves the odds of making sound decisions.

Don’t all agents have the same data?  

It’s logical to think that all agents, especially those who are REALTORS®, have access to the same data. Indeed, in our area, all REALTORS® can access the most extensive and comprehensive source of information for the St Louis residential real estate market — MARIS, the REALTOR® Multiple Listing System (MLS). Yet, simply having access to this wealth of information is only the first step. It’s akin to the internet: while you can find nearly any information you seek online, the real challenge lies in knowing where to find it and determining the most accurate sources. The same principle applies to real estate market data available in the MLS.

While most agents aren’t data nerds and often depend on aggregated data provided by others, our agents, to some extent, do the same. However, a notable difference lies in their ability to define criteria and create their own reports for their clients using our proprietary software. Furthermore, they don’t simply accept the data we provide — they scrutinize it, cross-verify it, and highlight any errors they discover. This level of commitment, while humbling, is a testament to their dedication to accuracy, even when the data comes from a trusted source like our company.

Copy and Paste Culture Among Many Agents...

Contrary to the scrutiny that our agents apply to our data, many agents merely copy and paste infographics or reports they receive, without cross-checking the information. Take, for example, the infographic below showing the median sale price of homes in May 2023 for the city and county of St Louis combined as $255,000. Yet, numerous agents are sharing a report that states the median sale price for that market in May was $285,000. That’s nearly 12% higher than the actual figure, a discrepancy I deem significant. If you’re a buyer basing your offer, even partly, on market data, wouldn’t it be better to know the median price is actually $255,000 and not $285,000? Your next question might be, ‘How do you know your data is accurate?’ I’ve discussed this in detail in a previous article, which remains applicable today.”

Continue reading “St Louis Real Estate Market Report for May 2023 with accurate data you can trust

Are Homebuyers Today Grossly Overpaying for Homes and Making Decisions They’ll Regret?

I’ve been in the real estate business since I was 17, which means it has been 45 years of experiencing various market conditions, including recessions, inflation, 18% mortgage rates, the burst of the housing bubble, and a myriad of other good and bad things. However, I can confidently say that I have never witnessed a real estate market quite like the one we have been experiencing in the past couple of years.

So, what makes the current real estate market so unique?
First and foremost, I’ve pondered this question extensively, and I honestly can’t recall a time in this industry when the supply of homes for sale was not at least 4 to 6 months’ worth. Although there was a brief period in 2015 when the inventory of homes in St. Louis fell below 4 months, it quickly returned to nearly 5 months. From 2016 until early 2020, the inventory fluctuated between approximately 2 and 3 months, and then began a downward trend, hitting a record low of less than a 1-month supply in the latter part of 2021. While the supply has slightly increased since then, it still hovers around 1 month.

Months of Inventory – St Louis 5-County Core – 2013 – 2023

This situation showcases the basic law of economics—supply and demand. The supply of homes for sale in St. Louis is exceptionally low, and even though the number of home buyers in the market has seemingly declined significantly over the past few years, there still isn’t enough supply to meet the demand of the remaining buyers. Consequently, in accordance with the law of supply and demand, prices tend to rise when supply is insufficient to meet demand. While it’s easy to increase widget production to meet demand, it’s not as simple to suddenly add thousands of homes to the market in the St. Louis real estate market. Factors such as a lack of available land for development in high-demand areas, lengthy approval processes for new developments, labor shortages in the trades, difficulty in controlling construction costs, and the significant time required to bring a substantial number of homes to the market contribute to this complexity. As a developer, I can attest that the development process is lengthy enough for the market dynamics to change entirely before the first home hits the market.

So, where did all the houses go in St Louis?  Why aren’t there more homes for sale?

Continue reading “Are Homebuyers Today Grossly Overpaying for Homes and Making Decisions They’ll Regret?

St Louis Home Prices Have Increased by 112 Percent Since 2000; Rental Rates Rise by 68 Percent

As the infographic below illustrates (which is available exclusively from MORE, REALTORS®) the median price of a home in St Louis (the 5-county core market) has increased 112% since 2000, from $124,900 in 2000 to $265,000 in 2022.  During the same time period, the median lease rate, or rental rate, for a St Louis home has increased by just 68%, moving from $955 in 2000 to $1,600 in 2022.

Leasing a home is obviously a better deal, right?

If we set aside the benefits (and responsibilities) of homeownership and the long-term investment aspects, simply looking at the monthly cost might lead us to the conclusion that renting a home in St. Louis could likely save us money compared to buying one. After all, if we just consider the fact that during the aforementioned 22-year period, the cost of buying a St. Louis home increased by nearly 65% more than the cost of leasing one, we would certainly lean towards that conclusion. However, if we account for interest rates, which impact the monthly cost of owning a home (assuming financing is involved), we find that the gap significantly narrows. This is because even though interest rates are higher now than they were just a year or two ago – in fact, roughly double – they are still lower than they were in 2000.

Factoring in interest rates, the gap between buying and leasing narrows significantly.

In 2000, interest rates for a 30-year fixed rate mortgage varied but averaged roughly 7.5%. In contrast, they were around 6% in 2022. As the infographic shows, when we take these rates into account to assess the monthly cost of owning a home, we observe that even though home prices have risen by 112% since 2000, the house payment on a median-priced home has only risen by 82%. While the increase in house payments at 82% is still greater than the 68% increase in leasing, the gap is much smaller. Once other benefits of homeownership are factored in, it becomes easier for many people to justify the additional cost of ownership.

To clarify, I am not claiming that homeownership is for everyone or that leasing is inherently inferior. In fact, I’ve been one of those people who have consistently said that homeownership isn’t for everyone. For many individuals, based on factors like their likelihood of relocating, job and financial stability, money management skills, and others, leasing can be a better alternative. I am simply trying to highlight that the cost gap between the two options may not be as wide as it initially appears.

Continue reading “St Louis Home Prices Have Increased by 112 Percent Since 2000; Rental Rates Rise by 68 Percent

When will the St Louis real estate market crash?

What strange and confusing times we live in! Some seemingly credible predictions made by qualified experts suggest that our banking system could collapse, our currency may become worthless, and our country may face a significant downturn. Meanwhile, others claim that there is no cause for alarm. Here in St. Louis, the real estate market continues to thrive as if everything is great in our economy, despite the fact that interest rates have doubled in the past year. I have been in this business for 43 years, and although I have seen many ups and downs in the market, I have never seen anything quite like this before. It appears that there is a stark dichotomy between the economy and the St. Louis real estate market at present, as if they are two entirely separate entities. Could this be the result of the low inventory and high demand for housing, leading homeowners to throw caution to the wind? Or is it possible that the St. Louis economy is stronger than the national economy? Whatever the reason may be, despite talk at the national level of a looming housing market crash, the St. Louis real estate market continues to thrive.

Is the St Louis real estate market going to crash?

Now, onto the question of whether the St. Louis real estate market is going to crash. This is a fair question, given the current issues outlined above. However, so far, there are no clear signs of a crash. That’s not to say that there won’t be any changes to the market, as I believe we’ll see some, but nothing that indicates a crash is imminent at this point. Almost a year ago, I wrote an article in which I stated that “I don’t think St. Louis home prices will come crashing down, in fact, I don’t even think they are going to decline necessarily.” This prediction has proven to be accurate. However, I also said in that same article that “I think the premiums buyers have paid over and above the value of the home they were buying are going to quickly come to an end,” and this has proven to be inaccurate.

Despite my prediction, there are still bidding wars happening between buyers on new listings. The STL Market Chart table below shows that last month, the median price of homes sold was equal to 100% of the current list price at the time of sale. Given that the median is indicative of the midpoint of the frequency of values, if the midpoint is 100%, then it appears that plenty of homes are selling in excess of the list price.

The data for the St. Louis real estate market shows that there is a strong buyer demand. In addition, the market is facing the persistent issue of low inventory. These factors have contributed to the resilience of the St. Louis housing market, making it unlikely to succumb to a crash at this point. However, if there is increased economic uncertainty, inflation, and rising interest rates, we may reach a tipping point and see St. Louis home prices decrease. Despite this possibility, it is unlikely to happen anytime soon based on current data.

Continue reading “When will the St Louis real estate market crash?

Report Says U.S. Home Prices Dropped 3% in March, the Biggest Annual Decline in Over a Decade; However, This Was Not True in St. Louis

A report released today by Redfin reveals that the median U.S. home sale price in March was $400,528 marking a 3.3% decline from March 2022 when the median home price was $414,196. However, the situation in St. Louis is quite different. According to the STL Market Chart (available exclusively from MORE, REALTORS®) below the median price of homes sold in St Louis in March was $260,000, which represents an increase of 4% from March 2022 when the median home price was $250,000.

The chart also depicts the 12-month home sales trend for St. Louis, indicated by the dark green line, which shows a decline since September 2021. During the 12-month period ending on September 30, 2021, there were 30,728 homes sold in the 5-County Core St. Louis market. However, this has fallen monthly, reaching 24,577 for the 12-month period ending last month.

St Louis 5-County Core Market Home Prices and Sales Trend

Click on the chart for a live, interactive chart.
St Louis 5-County Core Market Home Prices and Sales Trend

Why an online auction may be the best way to buy or sell a home in St Louis

Recently I wrote a lengthy article about various current issues that are likely to bring significant changes to the real estate industry. These changes will also affect the process of buying or selling a home for consumers. Although I may be in the minority within the industry, I strongly believe that most, if not all, of the changes will benefit both consumers and real estate professionals.

One of the first changes that may happen is the elimination of the requirement for sellers to pay the commission to the buyer’s agent in order to list their property in the REALTOR® MLS system. Although sellers can still choose to pay buyers’ agents, the process will become more transparent for all parties involved.

Nearly two years ago, our brokerage, MORE, REALTORS® created an online real estate auction site called HomeAuctionMLS.com to provide an alternative for buyers and sellers that addresses many of the issues raised in class-action lawsuits and the investigation by the Department of Justice. The auction platform was designed to offer a transparent and fair process for both parties while ensuring that they still have the option to be represented by real estate professionals. Moreover, sellers do not have to pay the buyer’s agent’s commission, and they can even use the auction platform without paying any commission at all.

What are the benefits of selling your home on HomeAuctionMLS.com?

  • Transparency: The auction process is transparent and open to all potential buyers, ensuring a fair market value for the property.
  • Competitive bidding: Auctions generate competition among buyers, often resulting in higher sale prices than traditional listings.
  • Control: The seller has more control over the sale process, including setting the reserve price and choosing the auction date.
  • Reduced holding costs: Since the sale process is typically faster, the seller can avoid paying holding costs such as property taxes, utilities, and maintenance fees for an extended period of time.
  • Convenience: Online auctions can be conducted from anywhere, allowing sellers to avoid the hassle of in-person showings and open houses.
  • Increased exposure: Online auctions can attract a wider audience of potential buyers from all over the country, increasing the chances of a successful sale.

What are the benefits of buying a home on HomeAuctionMLS.com?

  • Transparency is key in the auction process, as it ensures that all potential buyers have an equal opportunity to make a purchase. This means that you won’t lose out on a property simply because of the timing of your offer, or because you chose not to include a letter to the seller. Furthermore, the open and transparent nature of auctions ensures that you won’t be outbid by another purchaser who offers different terms than yours. Overall, the transparency of the auction process promotes fairness and equal access to all potential buyers.
  • You’re the one in control during an auction. Unlike in a traditional real estate transaction where the listing agent or seller has the final say on which buyer to accept or which escalation clause to activate, the decision to purchase the property is entirely up to you. You have the power to keep bidding if you want to, and you also have the power to remove yourself from the equation if the bidding gets to a point where you are no longer interested. Essentially, you are in control of the entire process and can make decisions based on your own preferences and priorities. By taking control of the situation, you can feel confident that you are making the best decision for yourself and your future.

If you would like to learn more about buying or selling a home, condo, or other property at auction, please don’t hesitate to contact us by clicking the button below. Additionally, you can find additional resources and information below to help you get started.

Do you need a buyer’s agent when buying a home in St Louis?

Earlier this week I wrote an article addressing some of the current issues that will likely significantly impact the residential real estate business.  IIn the article, I suggested that, as a result of the various challenges to present-day practices, sellers may no longer be required to pay commissions to the buyer’s agent in the near future.  Does this mean the role of the buyer’s agent in a transaction is going away and that buyer’s agents are not needed?  The short answer is no, buyer’s agents are not going away.

So, buyer agents won’t be impacted by these changes?

Wait, I didn’t say there no impact or effect on buyer’s agents, I said, generally speaking, they are not going away. However, this doesn’t mean that there won’t be real estate agents leaving the profession as a result of not being prepared, able, or willing to deal with the changes. Some agents will leave the profession because, quite frankly, with the change in the way buyer’s agents are compensated, they will find that there are not enough people who see value in paying them to represent them. I know this sounds a little harsh, but I’ll explain what I mean in more detail below.

The bar will be raised…

While my earlier statement sounds a little harsh, I think the reality is that agents that are not committed to this profession, lack the knowledge and skills they should have and don’t deliver the level of representation and service they should to their clients, are going to find it hard to survive in the business in the near future. As transparency increases on how buyer’s agents are compensated, particularly when it becomes known that the compensation is either coming directly from their buyer client or indirectly from them, buyers are likely to be more selective about the agents they choose to work with. Some may argue that buyers may opt to forego having a buyer’s agent and deal directly with the listing agent instead to save some money. I will address that in more detail later, but for the most part, I don’t think that will be the case. Instead, good agents, those who know this business and the market and are true professionals with their clients’ interests at heart, will be rewarded.


Continue reading “Do you need a buyer’s agent when buying a home in St Louis?

Do the Fed Funds rate and M2 money supply really matter to the St Louis real estate market?

For the past several months there have been many reports anticipating the moves of the Federal Reserve regarding interest rates then followed by tons of articles, blog posts and videos analyzing then predicting the impact of the Fed’s decision on the economy.  The other popular topic in this area is the “Money Supply”, usually M2 money supply and whether it’s increasing or decreasing as well as the impact on the economy.

Should St Louis homeowners and potential home buyers really care about the Fed Funds rate or M2 money supply?

First, let’s talk about the Fed Funds rate and what it is, what it is intended to do and the affect it can have on the real estate market.  The Fed Funds rate is the interest rate at which banks lend to each other overnight to maintain their reserve requirements. This rate is set by the Federal Reserve, and changes to the rate can have a ripple effect throughout the economy, including the mortgage and housing markets. When the Fed lowers the Fed Funds rate, it can stimulate economic growth by making it cheaper for banks to borrow money, which can lead to lower mortgage interest rates. Lower mortgage rates make it more affordable for homebuyers to finance their purchases, which can increase demand for homes and drive up prices. Conversely, when the Fed raises the Fed Funds rate, it can lead to higher mortgage interest rates, which can slow down the housing market and lead to lower demand and prices.

Next, the the M2 money supply.  The M2 money supply includes cash, checking accounts, savings accounts, and other liquid assets that can be easily converted into cash. When the M2 money supply increases, it can stimulate economic activity by making more money available for borrowing and spending. This can lead to lower mortgage interest rates as well, as banks have more funds available to lend out. However, if the M2 money supply increases too rapidly, it can lead to inflation, which can cause mortgage interest rates to rise.

So, as you can see, both the Fed Funds rate and M2 money supply can have a significant impact on the cost of a home mortgage as well as home prices so I would say the answer to the question I posed is “yes”.  Granted, we don’t all need to become economists or stay up late at night pouring through spreadsheets and date, but to be aware of factors that affect the economy as a whole and as a result, the real estate market we’re in, would be wise.

How can knowledge of the Fed Funds rate and M2 money supply help me as a home seller or buyer?

The short answer is, it gives you a little insight into perhaps where things are headed which may help you make the decision to buy or sell sooner or later. For example, perhaps  you are contemplating buying an home but anguishing over the fact the mortgage interest rates are double what they were a year or two ago and you’re thinking maybe you should wait until things settle down.  Well, if you see the Fed Funds rate getting increased with talk of more increases while that is no guarantee mortgage interest rates will increase as well, as I explained above, it’s certainly an indicator that is a likelihood.  Therefore, you may decide it’s better to make a move now than later.

What’s an easy way to track this stuff?

I have the answer for you.  The charts below are two of the many charts and other information available on St Louis Real Estate Search as well as from MORE, REALTORS® .  The first chart shows the relationship historically between St Louis home prices and the M2 Money Supply.  Generally, they follow the same trend but, when the trend for one changes, like it did with St Louis home prices (the red line on the chart) beginning in the late 90’s through the housing market bubble burst after 2006, something happens to bring them back in line.  As you can see, starting a little over 3 years ago the pace at which M2 was growing outpaced St Louis home prices, but St Louis home prices quickly caught up. Now it’s the opposite and it looks like both a making a downward correction.

The bottom chart shows the close relationship between the Fed Funds rate and mortgage interest rates.  With little exception, when the Fed Funds rate increases or decreases, mortgage rates follow. For the past year, the Fed Funds rate has increased and the trend is upward so I wouldn’t expect to see falling mortgage interest rates anytime soon.

Continue reading “Do the Fed Funds rate and M2 money supply really matter to the St Louis real estate market?

St Louis Home Prices Increased At Twice The Rate Of Rental Rates From 2018-2022

Should I rent or buy a home in St Louis?  This is a question St Louis REALTORS® are often asked, especially in the past few years while homes appeared to be increasing weekly, there were often more than a dozen offers on a listing and generally the market seemed out of control.  Granted, some of that pandemonium has eased somewhat lately given the increase in interest rates and questions about the economy but the question still remains.  While there are many non-financial reasons people choose to buy their own home or condo versus rent, we’ll just look at the cost today.

Home prices increased at more than double the rate of rents…

As the chart below, exclusively available from MORE, REALTORS®, shows, the median price of homes sold in St Louis during 2018 was $178,800 and increased to $240,000 in 2022 for an increase of over 34% during the 4-year period.  The median rental rate of homes leased in St Louis during 2018 was $1,250 and increased to $1,450 in 2022 for an increase of 16% during the same 4-year period.  During this 4-year period the rate at which the price of St Louis homes increased was more than double the rate at which the rental rates of St Louis homes increased.

Factor in interest rates and the cost of home ownership increase and monthly cost of home ownership 

As the second chart below shows, mortgage interest rates during 2018 were in the mid-to upper 4’s and in the 6’s and even hit 7% during 2022 so this means in addition to home prices going up, payments went up even more.  For the sake of this comparison, we’ll use 4.7% as the rate for 2018 and 6.7% for 2022.  Therefore, the payment on a typical home in 2018 (principal and interest only based upon a 5% downpayment) would have been $881 per month and in 2022 increased by 67% to $1,471 per month.  So, while the actual price of a home increased 34% during the period the monthly cost of it, in terms of house payment, increased at nearly double that rate, 67%.  During the same period rents increased just 16% so the monthly cost of buying a home increased four-times as much.

Continue reading “St Louis Home Prices Increased At Twice The Rate Of Rental Rates From 2018-2022

St Louis Home Sales Trend Drops To Lowest Level In Over Seven Years

For the 12-month period ended January 31, 2023, there were 24,993 homes sold in the St Louis 5-county core market which, as the STL Market Report below (available exclusively from MORE, REALTORS®) shows, is nearly a 17% decline in home sales from the the prior 12-month period when there were over 30,000 homes sold.  The median price of homes sold during the most recent 12-month period was $266,500, an increase of 6.6% from the prior 12-month period.

St Louis home sales trend falling fast….

Below the market report is a STL Market Chart showing (also available exclusively from MORE, REALTORS®) the 12-month home sales and home price trend for the St Louis 5-County core market for the past 10 years.  The green line on the chart depicts the 12-month sales trend for each month for the past 10-years revealing a decline in the St Louis home sales trend for the past 16-months.  The 12-month home sales trend in St Louis is now at the lowest level (24,993 homes) since November 2015 when 12-month St Louis home sales were are 24,772.

St Louis home price trend falling as well….

The red line on the chart depicts the median price per square foot St Louis homes sold at for the 12-month period ending in the month shown.  Home prices are seasonal and fluctuate every year, through good markets and bad markets, peaking in early summer and hitting a low in during winter.  However, the decline this year, from the peak in June at $189/foot to $172 in January (nearly a 9% decline) is a much larger decline than last year when were was just a 1.7% decline in price during the same period. In 2021 the price decline during the same period was just 1.3% .

Continue reading “St Louis Home Sales Trend Drops To Lowest Level In Over Seven Years

St Louis Home Prices and Rental Increasing Faster Than Wages

A report just released by ATTOM data shows that St Louis home prices are rising at a rate significantly higher than the rate wages in St Louis are rising and St Louis rental rates are increasing at rates higher than home prices.  As the chart below shows, during the past year, wages in the St Louis metro area increased 3.8% however, home prices in St Louis increased 7.9% and rental rates increased 11.2%.

St Louis MSA – Housing Affordability

St Louis MSA - Housing Affordability 

Data source:  ATTOM Data – Copyright 2023 – all rights reserved, Guerrilla Brokers LLC


Franklin County Home Prices Increased at nearly double the rate for St Louis County From 2021 to 2022

The median price of homes sold in Franklin County increased from 2021 to 2022 at nearly double the rate the price of homes sold in St Louis County did during the same period.  As the chart below shows, the median price of homes sold in Franklin County during 2021 was $206,000 and then increased 6.7% to $219,800 in 2022. During the same period, the median price of homes sold in St Louis County increased 3.4% from 246,500 to $255,000.

[xyz-ips snippet=”Franklin-County-For-Sale-and-Open-Houses”][xyz-ips snippet=”St-Lous-County-Homes-For-Sale”]

Franklin County vs St Louis County Home Prices – 2021-2022

(click on chart for live, interactive chart)

Franklin County vs St Louis County Home Prices - 2021-2022


St Louis Home Prices Fall Over 12% And Sales Fall 40% In 6-Month Period

Kind of an attention-getting headline, huh?  At least it’s not as bad as a lot of the gloom and doom headlines I’m reading today about the real estate market.  Many folks out there are predicting a total meltdown of the housing market, and our economy as a whole for that matter.  Don’t get me wrong, I’m not drinking the “there’s nothing to see here” Kool-Aid, I do believe we are in for some rough times ahead, I am just not convinced it’s going to be as bad here in St Louis as in many parts of the country.

So back to the falling St Louis home prices and sales…

As the infographic below shows, the median price on homes sold in St Louis dropped 12.7% from June to December of last year and, during the same 6-month period, St Louis home sales declined 40%.  But, “I thought you said you weren’t gloom and doom?”.  Granted, this data doesn’t sound good but remember, the residential real estate market is very seasonal.  Prices and sales go up in the spring and down in the winter every year, during good markets and bad.  So, since June is often the peak of the market in terms of sales and prices, and December or January the trough where prices and sales fall to the lowest levels, this is normal.  The question is, whether the amount home prices sales declined in the past 6-months is pretty typical? As the infographic below illustrates both the decline in price and sales were the largest declines in the past 5-years.  The decline in sales in 2018 was close to this past year and the decline in prices in 2019 was close to this past year, but 2022 saw larger declines in both.

It’s something to watch close but not time to panic yet…

While the seasonal decline now is greater than is typical, it certainly is not as bad as some markets are seeing.  The big question is what is going to happen in the next couple of months?  Typically January sees another decline in sales from December and a slight decline in price and February is about the same or sometimes starts to show an uptick in prices.  So, depending upon how things turn out this month and next we’ll have a better idea of whether we’ll see the normal recovery from the winter season or if we’ll see the market continue to deteriorate.

Continue reading “St Louis Home Prices Fall Over 12% And Sales Fall 40% In 6-Month Period

St Louis Real Estate Market Update – Video

Is the St Louis real estate market going to crash?  The national news is filled lately with reports of slowing housing markets throughout the country, increasing inventories, falling sales and prices.  Some prognosticators are predicting some metro areas will see home prices fall by as much as 40 or 50 percent.  Is the St Louis real estate market on a similar trajectory??  While I can’t predict the future, I can share data to help you see where the St Louis real estate market is currently as well as where the data shows it’s headed.  

[xyz-ips snippet=”Market-Update-Video–Media-Center”]

St Louis Real Estate Market Update - Video

[xyz-ips snippet=”Seller-Resources—Listing-Targeted”]

Franklin County Closed Home Sales In October Over 43 Percent Lower Than Last Year

As the tables below show, so far during October there have been 52 home sales closed in Franklin County, down 43% from the same period last year when there were 91 sales closed.  The median sold price this month for those closed sales in Franklin County has been $210,000 an increase of over 12 percent from the same period last year when the median prices homes in Franklin County sold for was $187,000.

The time it took listings to sell actually improved slightly with the median time being 43 days last October and 4o days this month. Last year the homes sold for a median of 100% of the asking price and this month it dropped slightly to 99.68%.

Franklin County Closed Home Sales Oct 1, 2021 – Oct 24, 2021

(click on table for all current data)Franklin County Closed Home Sales Oct 1, 2021 - Oct 24, 2021

Franklin County Closed Home Sales Oct 1, 2022 – Oct 24, 2022

(click on table for all current data)Franklin County Closed Home Sales Oct 1, 2022 - Oct 24, 2022

St Louis County Closed Home Sales In October Over 25 Percent Lower Than Last Year

As the tables below show, so far during October there have been 704 home sales closed in St Louis County, down 26% from the same period last year when there were 955 sales closed.  The median sold price this month for those closed sales in St Louis County has been $255,000 an increase of over 10 percent from the same period last year when the median prices homes in St Louis County sold for was $231,000.  The time it took listings to sell has not changed with both periods having a median of 12 days and homes sold for a median of 100% of the asking price during both periods as well.

St Louis County Closed Home Sales Oct 1, 2021 – Oct 24, 2021

(click on table for all current data)St Louis County Closed Home Sales Oct 1, 2021 - Oct 24, 2021

St Louis County Closed Home Sales Oct 1, 2022 – Oct 24, 2022

(click on table for all current data)
St Louis County Closed Home Sales Oct 1, 2022 - Oct 24, 2022

St Charles County Closed Home Sales In October Nearly 30 Percent Lower Than Last Year

As the tables below show, so far during October there have been 278 home sales closed in St Charles County, down 28% from the same period last year when there were 388 sales closed.  The median sold price this month for those closed sales in St Charles County has been $337,000 an increase of over 12 percent from the same period last year when the median prices homes in St Charles County sold for was 300.  Another bit of data which is illustrates the overbidding we’ve seen in the past that has quickly come to an end for the most part is that a year ago the St Charles County homes were selling for 102.32% of the listing price at the time of sale and for the closings this month it’s been 100% of the list price.  Granted, getting full price is a good thing it’s just seller’s were enjoying the bonus of overbids they were receiving before.

[xyz-ips snippet=”St-Charles-County-For-Sale-and-Open-Houses”]

St Charles County Closed Home Sales Oct 1, 2021 – Oct 24, 2021

(click on table for all current data)

St Charles County Closed Home Sales Oct 1, 2021 - Oct 24, 2021

St Charles County Closed Home Sales Oct 1, 2022 – Oct 24, 2022

(click on table for all current data)

St Charles County Closed Home Sales Oct 1, 2022 - Oct 24, 2022

Survey Shows Majority Of Consumers Think Now Is A Good Time To Sell A Home But Not Buy One

Monthly, Fannie Mae surveys consumers to gauge their sentiment toward whether it’s a good time to buy or sell a home and publishes the result in their Home Purchase Sentiment Index® (HPSI).  As the chart below illustrates, in the most recent survey, which was just released, the HPSI index was at 60.8, the lowest level in nearly 11 years.  No doubt the higher interest rates and softening economy are taking their toll on homebuyer’s optimism about the prospects of buying a home in the current market.  This marks the seventh-consecutive monthly decline in the index and the first time since May 2020 that more consumers thought home prices would decline than not.  In September 2022, the month covered in the latest report, only 19% of consumers thought it was a good time to buy a home while 59% felt it was a good time to sell.

You can access all the data and charts from the Fannie Mae Purchase Sentiment report here.

[xyz-ips snippet=”Homes-For-Sale”]

Fannie Mae Home Purchase Sentiment Index Chart 

(click on chart for live, interactive chart)

Fannie Mae Home Purchase Sentiment Index Chart 


Time On Market and Percentage of St Louis Listings With Reduced Prices Continues To Increase

As the infographic below illustrates, the time active listings in St Louis have been on the market is much greater than the time it took homes that closed last month to sell.  In addition, a much greater percentage of the current active listings have reduced their asking prices versus the sales that closed last month.

The most dramatic increase in days on the market was in St Charles County.   Active listings in St Charles County have been on the market a median time of 38 days, almost 5 times as long as the sales that closed in September where the median time on the market was just 8 days.  All 5 counties reported below saw the percentage of listings with a price reduction go up about the same, from twenty-something percent to forty-something percent.

Continue reading “Time On Market and Percentage of St Louis Listings With Reduced Prices Continues To Increase

Fannie Mae Predicts Lower Home Sales and Home Prices Next Year

Yesterday, Fannie Mae released their October housing forecast in which they forecast, among other things, where home sales and prices are headed.  The report incudes a forecast for next year, which included:

  • Home prices in 2023 to decline 1.5% from 2022
  • Home sales to finish 2022 down nearly 18% from last year and drop another 22% in 2023
  • New home construction to end 2022 down 3.6% from last year and drop another 25% in 2023.
  • Mortgage Interest Rates will continue to rise the rest of these year, ending the year at 6.7% and then will ease back to 6.4% in 2023.

See Fannie Maes Complete Housing Forecast HERE

St Louis Real Estate Market Report For September 2022

Below is our St Louis Real Estate Market Report for September 2022 for the City and County of St Louis combined.  You can access the full infographic, containing data for St Charles, Jefferson and Franklin Counties as well by clicking on the image below.  Worth noting and remembering is not all data is created equally nor is all of what you see reported accurate.  Given the challenging and rapidly changing economic times we are in which are having an direct impact on the St Louis housing and real estate market, now, almost more than ever, you need to be sure the data you base your real estate decisions on is accurate and the agents you are trusting to get you through the process have the knowledge, information and accurate data they need to do so.  At MORE, REALTORS® we have developed proprietary software which uses the database we have created from the REALTOR® MLS (MARIS) to produce what we believe is the most accurate and relevant data and reports for the St Louis residential real estate market.  For example, currently, there are other sources reporting (and many, many real estate agents sharing the information without verifying) that the median price for homes sold in the City and County of St Louis during September was over 6% higher than our data shown below.  Think what an impact that could have on you if you base your decision to buy or sell a home on pricing data that is over stating the value.

Oh, how do we know we’re right?  We have proof, straight from the MLS, see the image below our infographic which is a screen shot straight from the MLS showing date for closed sales during the month of September in the city and county of St Louis.  You’ll find that the median price from the MLS is $250,000, the same as our data computed, the number of sales is a little higher in the MLS (20 or just over 1%) because while about 99% of sales are sent out in “feeds” to broker websites etc (including Zillow and Realtor.com) there are a few listings that are not and the DOM (days on market, or days to sell) at 10 is very close to our 12 (this is due to us using a slightly different method to compute median for the data).

St Louis Real Estate Report for September 2022

(click on infographic for complete report including other counties)
Continue reading “St Louis Real Estate Market Report For September 2022

Why St Louis Home Prices Are Going To Decline

A little over two weeks ago I wrote my most recent article addressing St Louis home prices titled “Will St Louis Home Prices Decline?” in which my short answer was “yes”, but kind of tongue in cheek and based upon the seasonality of home prices, but my longer answer was more vague.  I mentioned that there certainly is a correction coming but pointed out that there are so many variables that will affect prices that it is hard to say to what extent this correction will be.  While this is still true, a lot has happened in the short time period since that article that has caused me to become more bearish on the St Louis real estate market to the point where I’m confident St Louis home prices will decline.

What has changed in the last 16 days…

  • While it doesn’t directly impact the St Louis market, hurricane Ian has wreaked havoc on a lot of Florida and other areas and will no doubt impact the overall housing market and economy and likely in more of a negative way.
  • Interest rates have risen another 1/2% hitting and staying near 7%.
  • The Mortgage Bankers Association (MBA) just announced that mortgage applications dropped over 14% during the last week of September, the biggest one-week drop in 17 months and pushed their index down to the lowest point since 1997.
  • The percentage of active listings that have reduced the asking price at least once broke the 40% mark.
  • The 12-month home sales trend for St Louis for the period ending September 30, 2022 fell to the lowest point in over 2-years.
  • Active listings in St Louis have been for sale a median of 43 days over four times higher than the median time to sell during the past 2 years of 10 days.

Market data pointing to lower St Louis home prices…

  • The declining sales trend mentioned above.  As chart 1 below shows, home sales during September in St Louis were down nearly 19% from last September.
  • The declining home price trend.  Chart 1 also reveals the median price of homes sold during September 2022 was $267,500, only 2.8% from then September 2021 when the median sold price was $260,000 which was a 8.3% increase from September 2020 when the median price was $240,000.
  • Showings on active listings continues to decline.  Chart 2 shows there are almost 10% fewer showings of active listings now then there were in the first week of January (the slowest time of the year).  Last year at this time showing activity was over 30% higher than now and in 2020 it was abut 55% higher.  Fewer showings mean fewer sales in coming.
  • The widening gap between home prices and rental rates.  Chart 3 shows the home price index (blue line) rising above the rental rates (red line) at a fairly steep rate. Historically, such as the late 1980’s – 2000 shown on the left side of the chart, these two lines track closely with home prices slight below the rental rates line.  The last time home prices started increasing more than rents was in the early 2000’s and this continue until the gap widened to the point that something had to give…either home prices had to fall or rents had to increase.  In 2008, the bubble burst and home prices fell.  While the present gap is not as large as it was during the height of the housing market bubble in 2006-07, we’re headed that way.
  • CPI and St Louis Home Price Index are hitting bubble levels.  Chart 4 shows the rate of change (year over year) in CPI and the  St Louis home price index.  The rate of change in both has already exceeded what in the past (with the exception of 1979 when it went a little higher) has triggered home prices to fall.
  • Home price and interest rate increases are killing St Lous home affordability.  Table 5 shows that currently, based upon median home prices and interest rates, one year of house payments (principal and interest only) take about 30% of the median household income for St Louis.  In 2007, at the peak of the housing bubble, it was only 21% and in 2000, which many economists use as a “normal” or baseline year, it was 20%.  So the real cost of a typical St Louis home to a typical St Louis family is about 50% higher now than normal.

Continue reading “Why St Louis Home Prices Are Going To Decline

Mortgage Interest Rates Top 7 Percent for first time in over 20 years

Today, the interest rate for a 30-year fixed-rate mortgage hit 7.08% marking the first time in over 20-years the rate has gone above 7%.  Historically speaking, as the 2nd chart shows, this is not that high of an interest rate and, in fact, lower than the median rate over the past 50 years, however, it’s a very high rate based upon the the recent past.

The affect of interest rates on home prices…

Interest rates just began increasing in the past few months, rising above the 4% level in February, so it will take time to see the impact of this on home prices.  We’re beginning to see the effect in prices somewhat, particularly with the decrease of “overbids” and an increase in reduced prices on active listings, but nothing too dramatic yet.  For example, as the bottom chart shows, the median price of homes sold in St Louis in August was $280,000, a nearly 11% increase from the median price of $252,450 a year ago. Since home prices typically peak around June, they are usually lower in August than June or July.  If we examine this to see if perhaps there was a bigger decline in those months this year than last we find that last year prices dropped 3/4 of 1% from June to July and then dropped 4% from July to August, for a total decline of 4.7% from June’s peak to August.  This year, prices dropped 3.9% from June to July, then 1.7% from July to August for a total decline of 5.6%, only slightly higher than last year.  I do think we’ll see a larger impact than this, but thus far it’s not so bad.


Mortgage Interest Rates Based Upon the MND Rate Index

(click on chart for live, interactive chart)

Mortgage Interest Rates Based Upon the MND Rate Index

30-Year Fixed Rate Mortgage Interest Rates 1970-Present

(click on chart for live, interactive chart)

30-Year Fixed Rate Mortgage Interest Rates 1970-Present

St Louis 5-County Core Home Prices and Sales – Past 25 Months

(click on chart for live, interactive chart)

St Louis 5-County Core Home Prices and Sales - Past 25 Months

Will St Louis Home Prices Decline?

The short answer is yes.  They decline every year as we head into winter due to the seasonal nature of the business.  If you look at the first chart below which depicts the median price of homes sold in the St Louis 5-County core market since 1998, you will notice a very consistent pattern of prices rising in the spring and summer, then declining in the fall and winter.  For the most part, the other pattern you will see is that the peak each spring is higher than the spring before and the bottom each winter is higher than the winter before, but there are exceptions to that such as after the bubble burst in 2008.

So, as we head into the fall season, we can expect home prices to decline.  The question is, given all that is going on in the economy, including mortgage interest rates in excess of 6%, will the decline be more than the typical “seasonal adjustment”?  To address this, the first thing we can look at is the percentage decline we’ve seen in the recent past from the summer peak to September which is as follows:

  • 2019 – Summer peak to September –10.9%
  • 2020 – Summer peak to September – 0% (no change)
  • 2021 -Summer peak to September –1.9%
  • 2022 -Summer peak to September –10.2%

What this reveals is this years decline, while definitely larger than the last two years, is actually less than the decline in 2019 (which was a good market) so this doesn’t jump out as particularly alarming.  I think it’s worth saying that we are no doubt going to have a market “correction” or “adjustment” at a minimum because home prices could not simply keep increasing like they have been so this years seasonal adjustment may just be a return to normal.  Having said that though, since the “bottom” of the winter market price-wise doesn’t usually come until January or February, we will need to watch the next couple of months to see if this downward price trend remains consistent with historic norms or in fact picks up steam and looks like it’s headed for a bigger decline than normal.  My guess is at this point it the latter.  While I’m not a “gloom and doomer” in fact, I like to think of my self as an opportunist and see opportunities in challenging markets, I just think I’m being realistic.  There are a lot of moving balls in the air right now with regard to our economy and more unknowns than certainties in my opinion.

We can’t underestimate the impact of interest rates either…

Continue reading “Will St Louis Home Prices Decline?

One-Third Of St Louis Homes Listed For Sale Have Reduced The Price

We continue to see more price reductions on listings, or, as some agents prefer to refer to them as “price improvements”, throughout the St Louis area.  As the infographic below depicts, as of today one-third of the active listings in the St Louis 5-County core market have a current asking price that is below their original price.

Continue reading “One-Third Of St Louis Homes Listed For Sale Have Reduced The Price

Will The Housing Market Crash?

Apparently a lot of consumers are concerned about the housing market crashing or at least concerned enough to be online searching for answers.  According to Google Trends the search phrase “Will The Housing Market Crash?” has hit it’s 5-year peak in terms of interest level during the last 4-5 months.  In addition, according to Google Adwords tools, there are 10,000 – 100,000 searches for month for the phrase “Will The Housing Market Crash?” and 100,000 – 1,000, 000 monthly searches for “housing market crash“.

Will there actually be a housing market crash in St Louis?

I guess first we should define “crash” as the word itself sounds rather harsh.  But if we agree that a market crash would be less severe than the housing market bubble burst we witnessed in 2008, then I would say a “crash” is more likely than a bubble burst.  However, what may seem like a crash in the St Louis housing market may in fact not be as much of a crash as well as a correction.  Given that the St Louis real estate market has been flying high for a few years now and many seller’s have felt like they died and went to heaven and buyer’s just felt like they died from the competition and difficulty in buying a home, a correction is really needed.

How bad will the St Louis housing market correction be?

Continue reading “Will The Housing Market Crash?

Nearly One-Third Of St Louis Homes Listed For Sale Have Reduced The Price

Price reductions are quickly showing up more and more on real estate listings in the St Louis area.  As the Infograph below illustrates, 31% of the current active listings in St Louis have had at least one price reduction.  Since the price homes sell at isn’t known until closing and a home sale typically takes 4 to 6 weeks to close, the actual sold prices won’t reflect these price reductions for a while.  For example, in the past 30 days (through today) there have been 2,381 closings of home sales in the 5-county St Louis core market at a median price of 104% of the original list price.  In about a month we’ll revisit that stat and see how things look.

Continue reading “Nearly One-Third Of St Louis Homes Listed For Sale Have Reduced The Price

The Coming Recession and Its Potential Affect on St Louis Home Prices

Ever heard the expression “It’s not if, but when..”?  That is something that I’ve heard for a while now about a recession.  With everything that has happened to our economy including rising interest rates, rising inflation, the government printing more and more currency and running up greater debt, it seemed inevitable we would see a recession.  To officially be in a recession, the GDP (Gross Domestic Product) has to fall for two successive quarters.  For the first quarter of this year, GDP declined at an annual rate of 1.6%.  The second quarter GDP numbers won’t be released until later this month (July 28th) however, the GDPNow forecasting model of the Federal Reserve Bank of Atlanta is forecasting a decline of 2.1% in GDP for the 2nd quarter of this year at this point.  If their forecast is correct, we will officially be in a recession.

What happens to St Louis home prices during a recession?

There are many factors at play in every recession that make them unique, such as unemployment rates, interest rates, etc, making it unrealistic to think that home prices are going to behave the same way during every recession, however, I thought it would be worth looking at what happened during the last couple of recessions.

2020 Recession (Q1 and Q2) 

We had a short recession in early 2020 caused primarily by COVID that only lasted the minimum period of two quarters.  During this period, as the chart below shows, St Louis home prices continued to increase at a fairly consistent rate.  In 2019 the median price of a home in the St Louis MSA was $188,575 and in 2020 it was $208,000, an increase of 10.3%.  Then in 2021, the year after the recession, the median St Louis home prices was $227,000, an increase of 9.1% from the year before.

Continue reading “The Coming Recession and Its Potential Affect on St Louis Home Prices

Showings Of St Louis Listings Fall To Levels Below January

It’s no secret that the real estate market slows down in the winter and typically nearly screeches to a halt from shortly before Christmas to shortly after New Years.  Therefore, when tracking showing activity in the St Louis area, the first week of January of each year is used as the base, or “0” value and then each rolling 7-day period afterward is compared to that first week.

As the chart below shows, in 2020 and 2021 all weekly averages of showing activity were above the baseline of January until getting close to Thanksgiving, with the one exception being late March and Early April of 2020 which was a result of the COVID-19 pandemic beginning.  The orange line depicts this year and it shows showing activity all year has been below the levels of the prior two years for the most part, however, the gap has widened in the past couple of weeks.  On July 4th, for the prior 7-day period the number of showings was less than the first week of January and it dipped further on July 5th to 6.9% fewer showings during that 7-day period than the first week of January.  Granted, it is always going to dip around a holiday but last year for the period ended July 5th there were 9.1% more showings than the first week of January, for a difference of 16% from this year.

Rising interest rates and increased inflation are no doubt two of the big reasons for this along with a low inventory of homes for sale.

Continue reading “Showings Of St Louis Listings Fall To Levels Below January

Over One-Fourth of St Louis Homes For Sale Have Reduced Asking Prices

Price reduction, what’s that?  All we seem to have heard about the last couple of years with regard to home prices is how much OVER the list price buyers were having to pay in order to buy a home.  So, to be talking about price reductions today seems odd. However, as the infographic below illustrates, there have been listings with price reductions over the past couple of years, it’s just the current level of them is higher than we have seen in a while.

Continue reading “Over One-Fourth of St Louis Homes For Sale Have Reduced Asking Prices